
As debt hits new highs is the global economy sinking in a bog of borrowing?
The rise of global debt to a record $173 trillion has spawned a profusion of warnings that the world economy is about to sink into a bog of borrowing. Some are predicting dire consequences. Are they right?
In economics, one figure never tells the full story. Dig deeper, and you often find that the economic prophets of doom are being economical with the truth.
Here is a more complete story of global debt in charts.
Chart 1 shows global debt sky-rocketing from $60 trillion in December 2001 to $173 trillion in September 2017. That’s an average increase of over $18 billion per day.
Chart 1: Total Global Debt in USD (Billions)
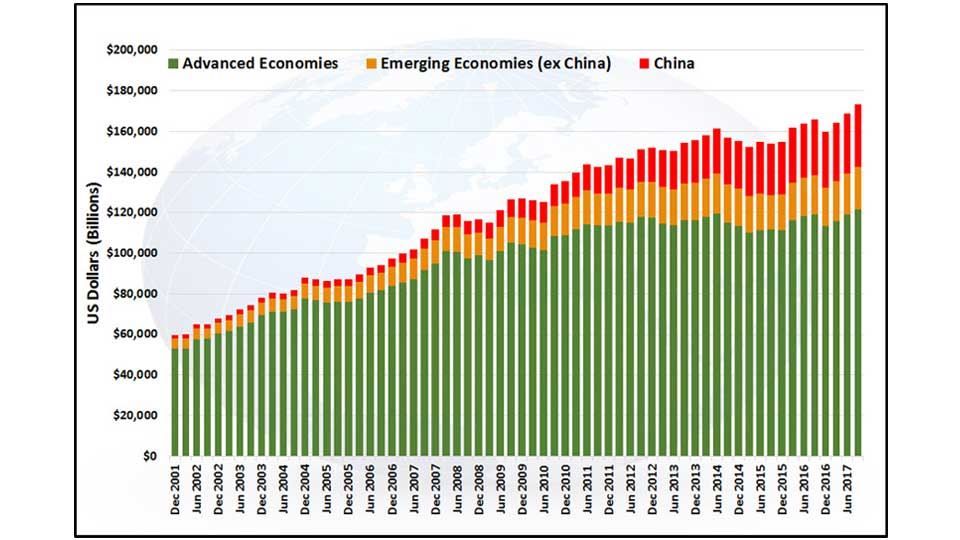
Source: BIS1 / Courtiers
As any lender knows, the nominal level of debt is irrelevant if it’s considered in isolation from the borrower’s ability to pay. This is why banks always consider debt relative to the borrower’s income. Chart 2 shows total debt as a percentage of global gross domestic product (GDP), broken down between advanced economies, emerging economies (excluding China) and China.
Chart 2: Debt as % Global GDP
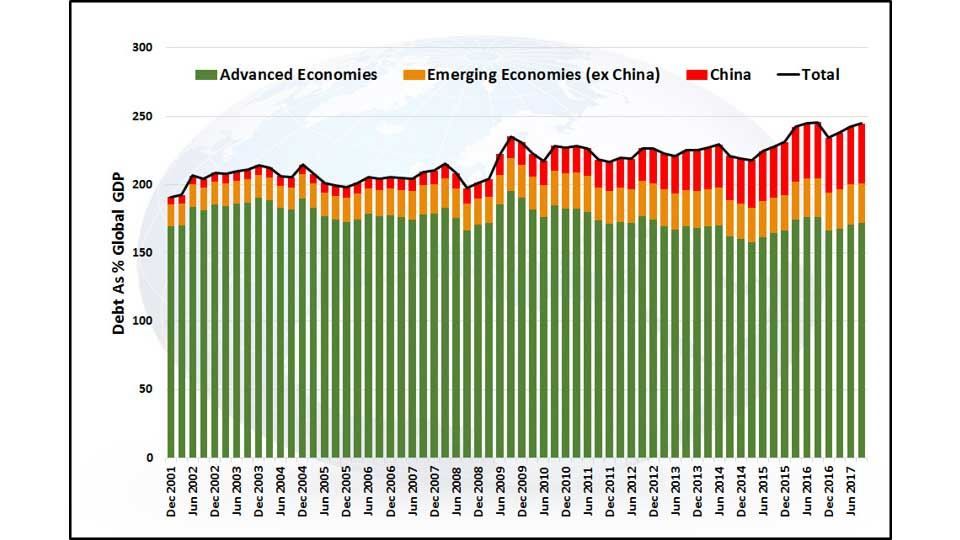
Source: BIS / Courtiers
The different sectors of the global economy have grown their levels of debt at different rates. Chart 3 shows that the rate of growth of debt in emerging economies has been faster than that of advanced economies, and in China it has grown fastest of all.
Chart 3: Debt as % of GDP
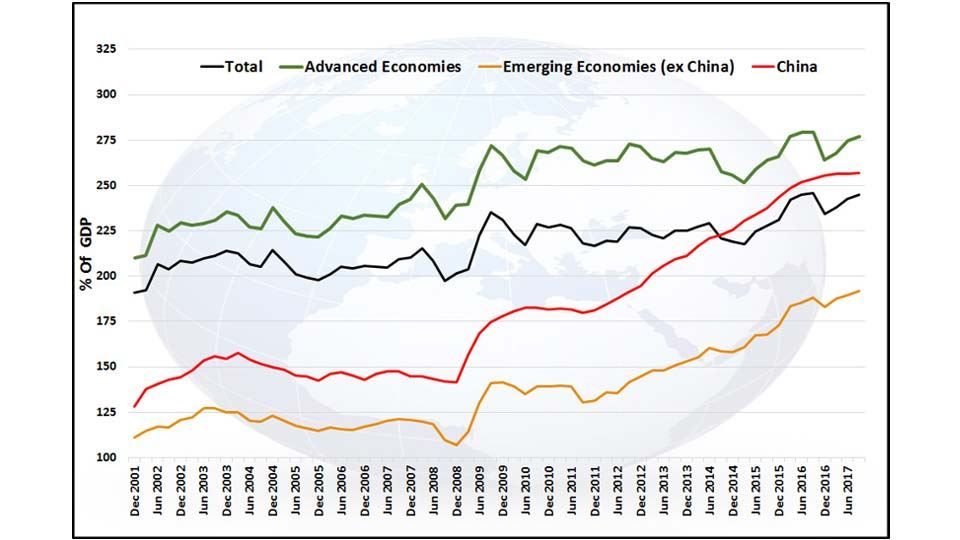
Source: BIS / Courtiers
It’s a fallacy that consumers are racking-up debt at breakneck speed. Households have been paying-down debt post the global financial crisis, as highlighted by Chart 4.
Chart 4: Global Debt by Sector as % of Global GDP
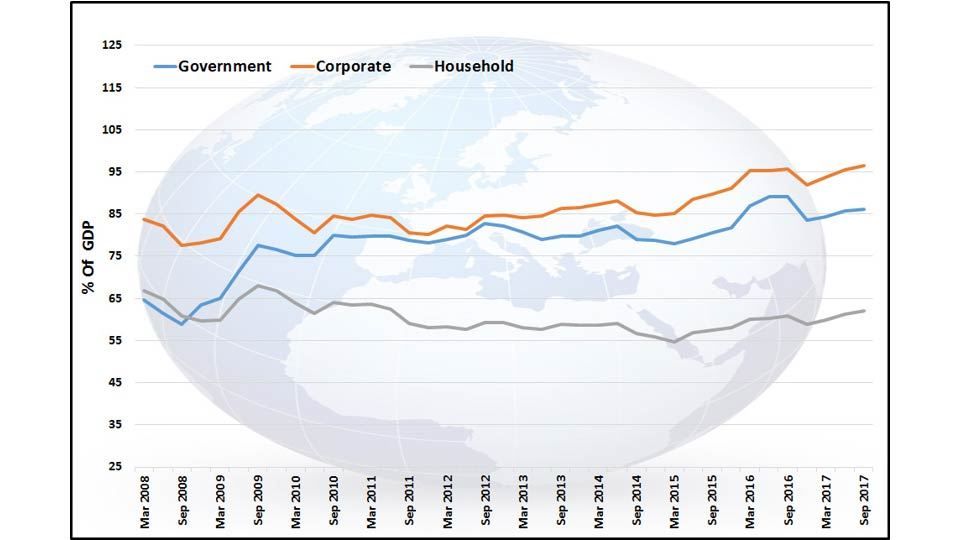
Source: BIS / Courtiers
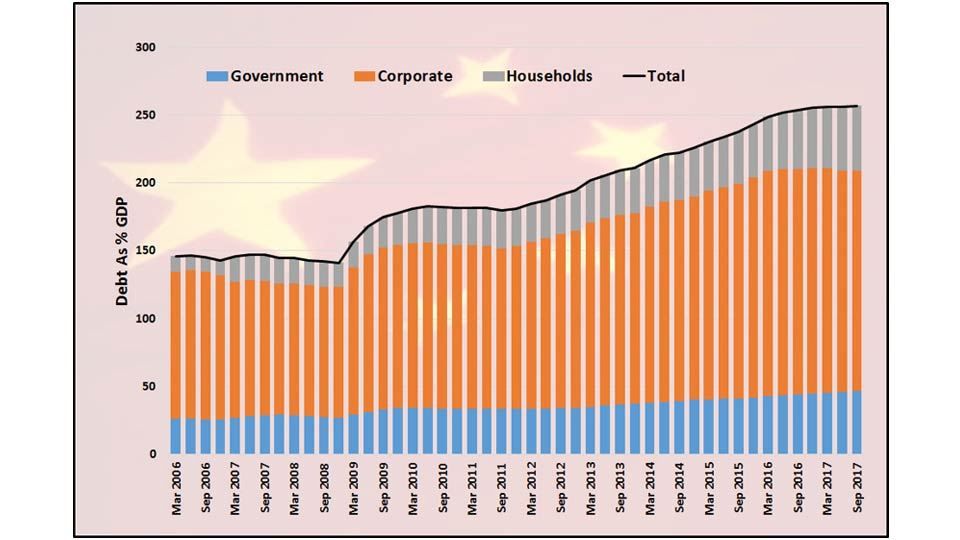
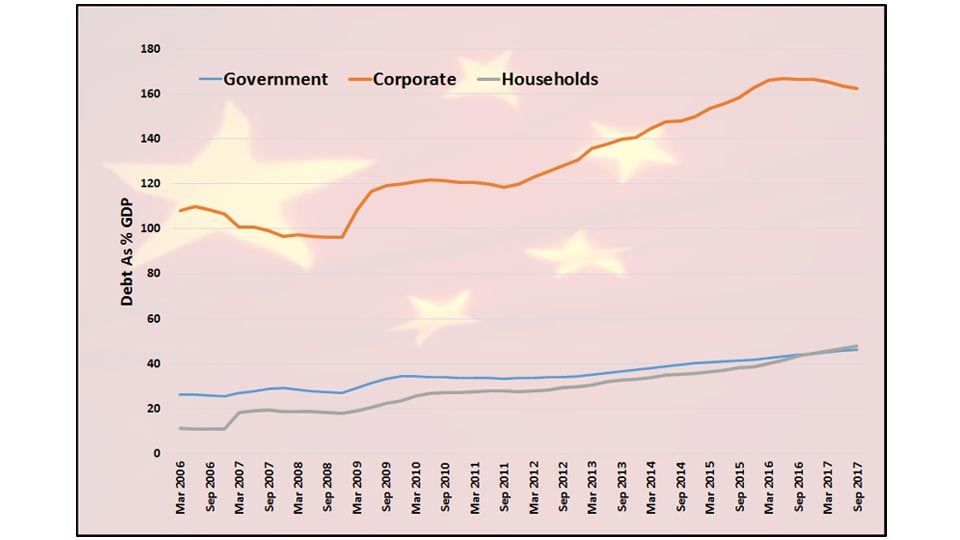
China’s appetite for debt is voracious. The breakdown of Chinese borrowing differs greatly from its developed economy counterparts. Corporates account for the lion’s share of debt in China (see chart 5) and the rate of growth of corporate debt has been faster than in either the government or household sectors (see chart 6).
Chart 5: China – Debt as % of China’s GDP
Source: BIS / Courtiers
Chart 6: China – Debt as % GDP
Source: BIS / Courtiers
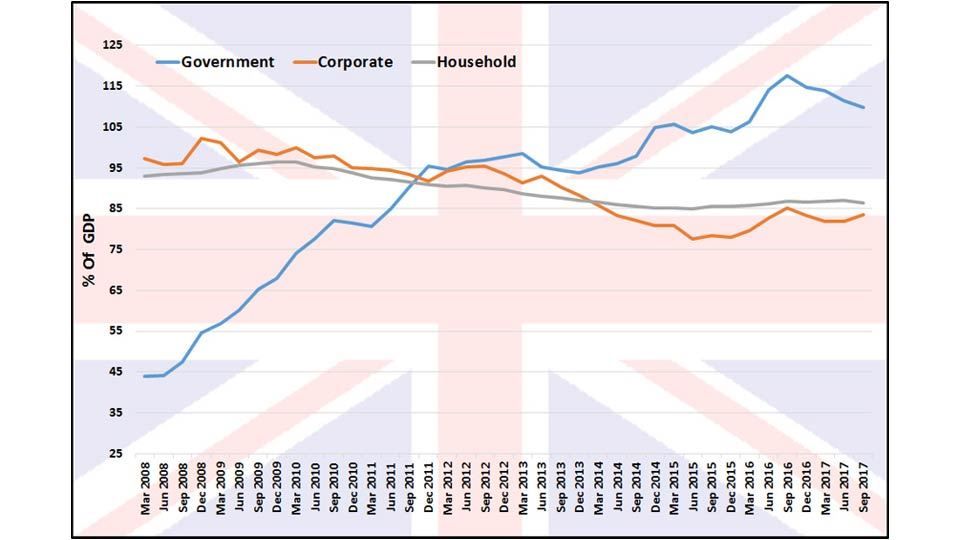
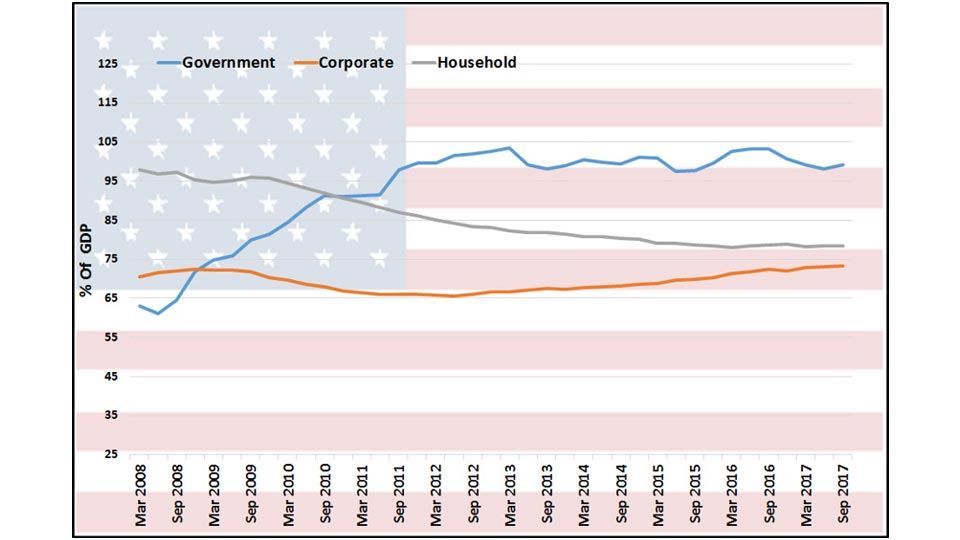
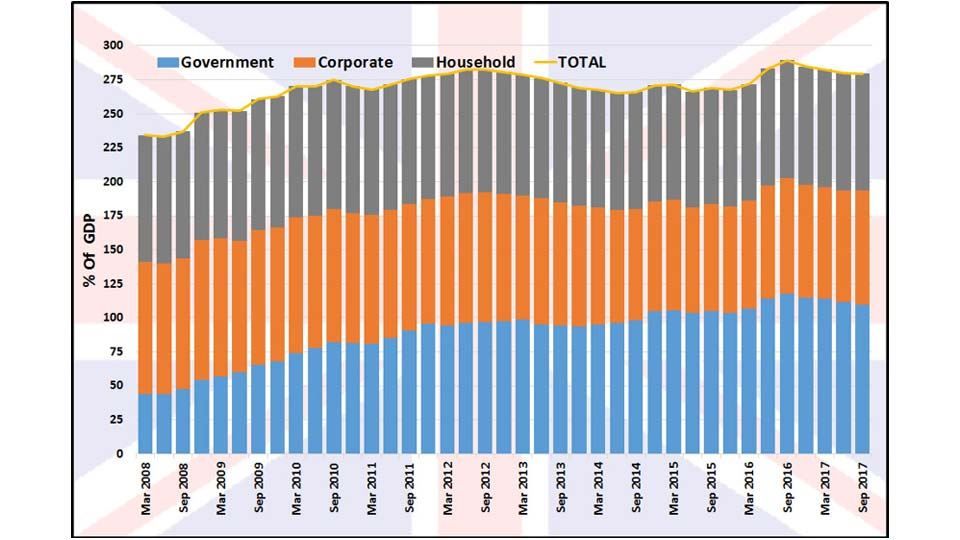
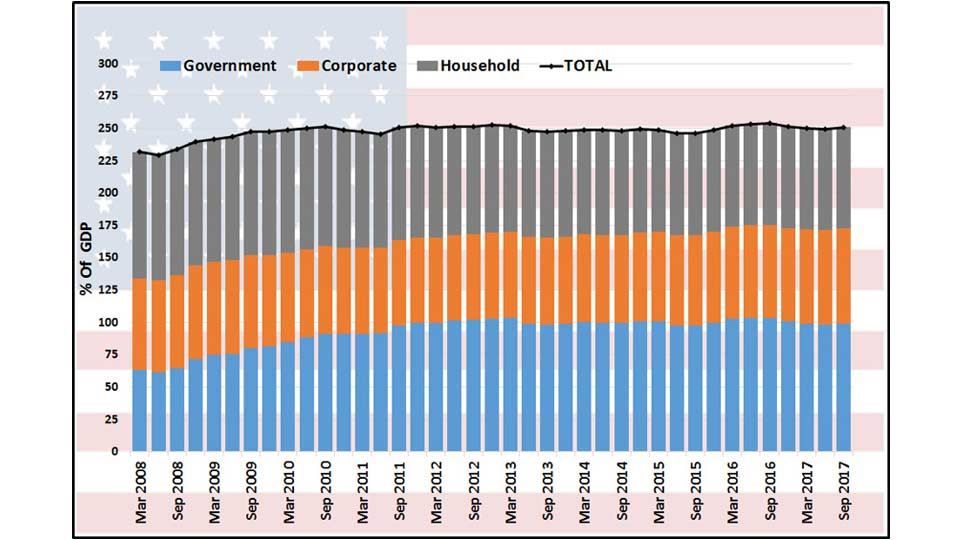
Government debt in the UK and US rose steeply after the global financial crisis as politicians and central banks borrowed to maintain liquidity and keep banks afloat. But companies and households were more frugal and have been re-paying debt for the last 10 years (see charts 7 and 8).
Chart 7: UK Debt by Sector as % of UK GDP
Source: BIS / Courtiers
Chart 8: US Debt by Sector as % of US GDP
Source: BIS / Courtiers
Company and household thrift was not enough to offset the rise in public sector borrowing on both sides of the Atlantic, with the result that total debt as a percentage of GDP rose, post the global financial crisis, in both the UK and US (see charts 9 and 10).
Chart 9: UK Debt by Sector as % of UK GDP
Source: BIS / Courtiers
Chart 10: US Debt By Sector as % of US GDP
Source: BIS / Courtiers
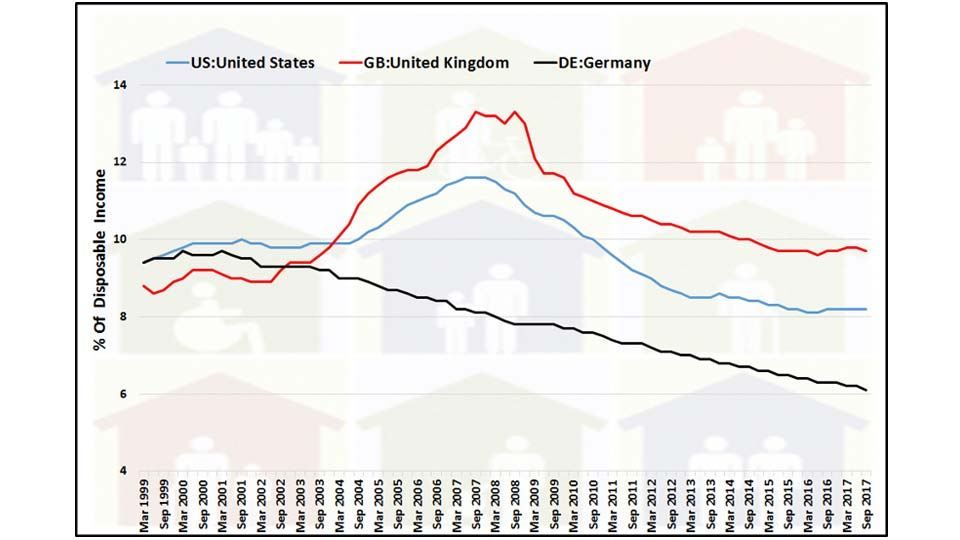
With interest rates dropping precipitously after the collapse of Lehman Brothers in 2008, and families paying down debt in the years that followed, one would expect debt servicing costs to drop relative to family income, and they have. Household debt servicing ratios have trended downwards for nearly 10 years (see chart 11).
Chart 11: Household Debt Servicing Ratio
Source: BIS / Courtiers
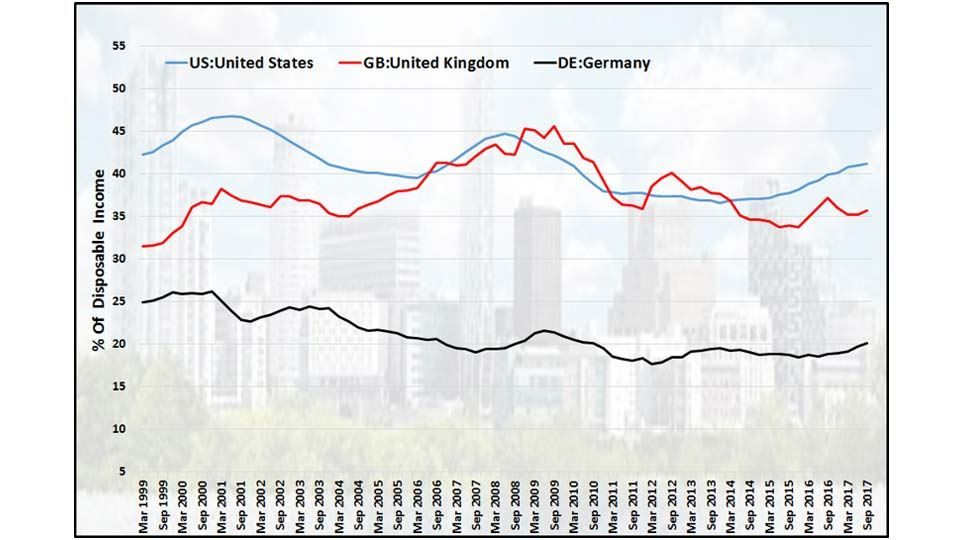
The proportion of corporate earnings absorbed by debt servicing costs have also diminished (see chart 12).
Chart 12: Corporations Debt Servicing Ratio
Source: BIS / Courtiers
Talk of a global debt binge is greatly exaggerated. Developed economies have generally seen a rise in government debt post the global financial crisis, but in most cases the ratio of government borrowing to GDP is not at a level that should give investors cause for concern. In the UK, government debt to GDP has returned to around its long-term average (see chart 13).
Chart 13: UK National Debt % GDP 1700-2015
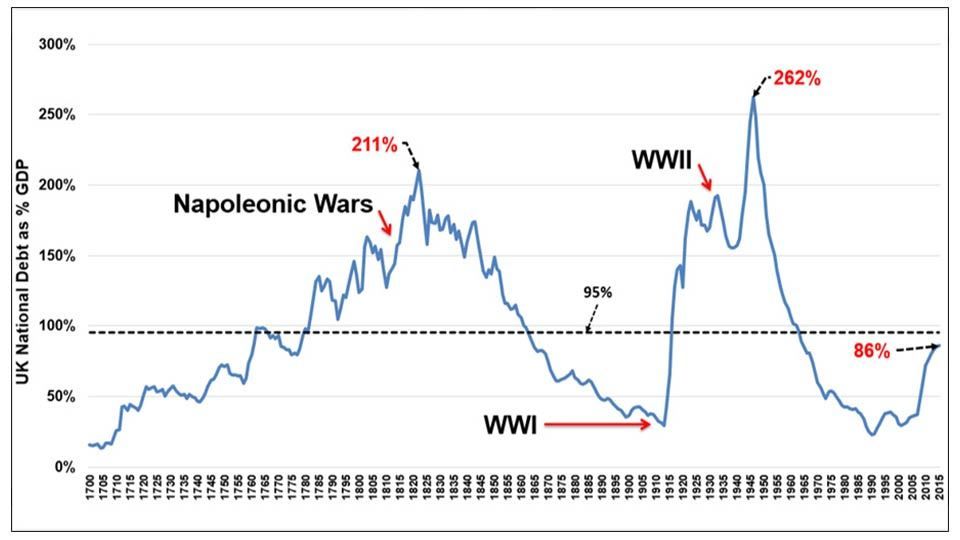
Source: Bank of England / Courtiers
Unequivocal evidence of a sea-change in the mentality of UK households is the Bank of England’s mortgage equity release figures. For nearly 40 years, aside from a brief interval of parsimony, UK home-owners withdrew equity from their properties through borrowing. This stopped dead in its tracks in 2008, since when UK home-owners have been paying back mortgage debt rather than borrowing more (see chart 14).
Chart 14: UK Housing Equity Withdrawal as % of Post Tax Income
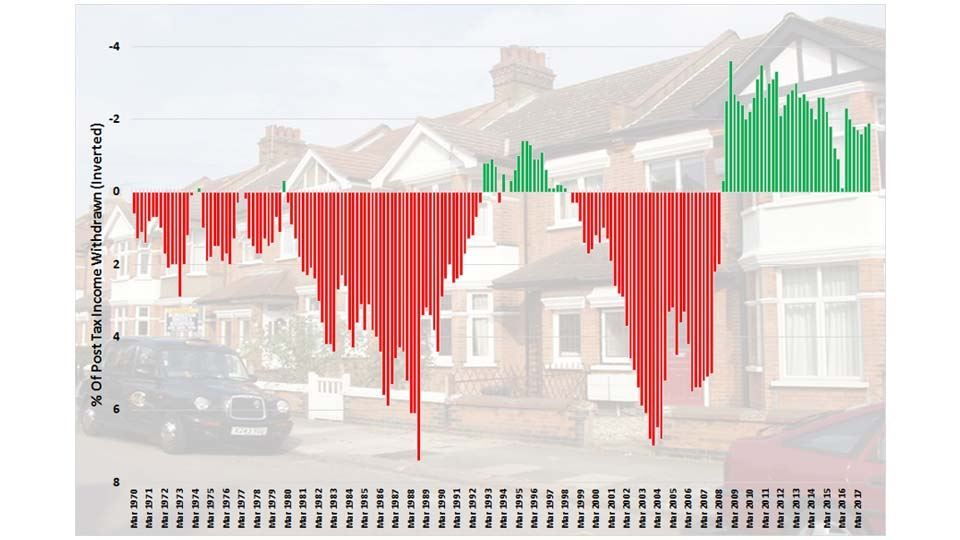
Source: Bank of England / Courtiers
Although UK households have increased nominal borrowings in recent years they have increased their assets at a faster rate (see chart 15).
Chart 15: UK Household Net Wealth
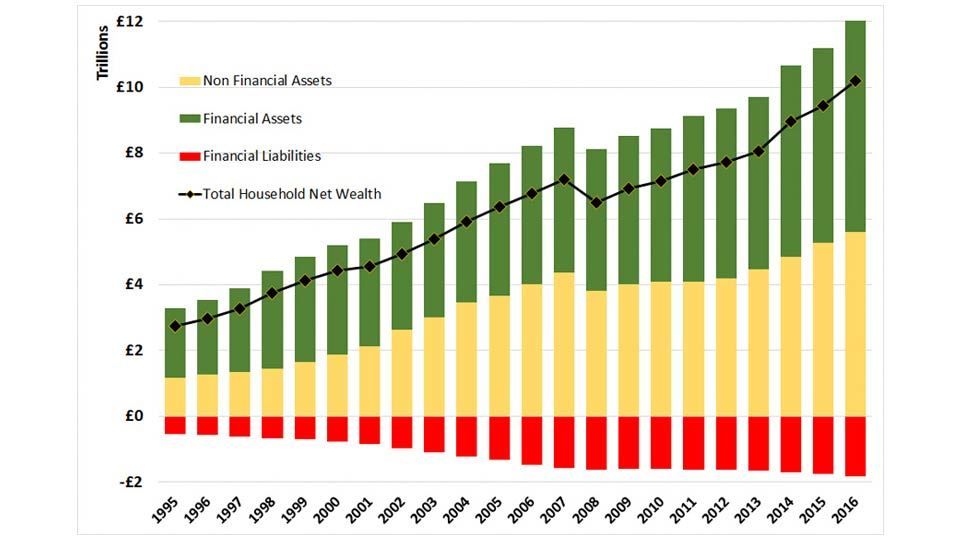
Source: ONS2 / Courtiers
As a result, average net wealth per household has risen steadily since the global financial crisis to new record levels (see chart 16).
Chart 16: UK Average Household Net Wealth
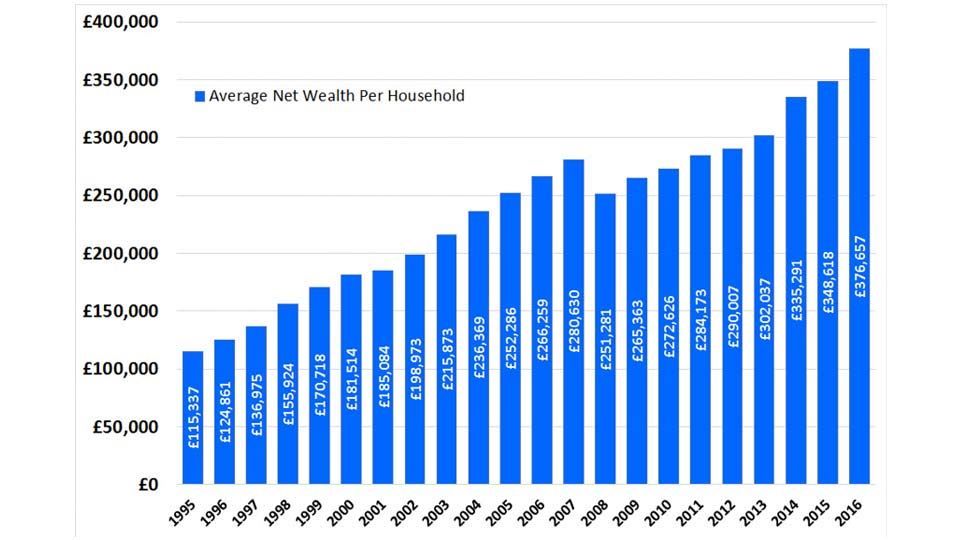
Source: ONS / Courtiers
After allowing for total debts, UK households have over £10 trillion in net assets (chart 15) and average net wealth of over £376,000 per household (chart 16).
Summary
Government debt in the advanced economies has risen relative to GDP as a result of the global financial crisis.
Households and companies in the advanced economies have paid-down debt relative to income.
China has significantly increased borrowing. At the same time, it has made great strides to catch-up on its output per head compared to advanced economies (chart 17).
Chart 17: GDP per Head Based on 2011 International $
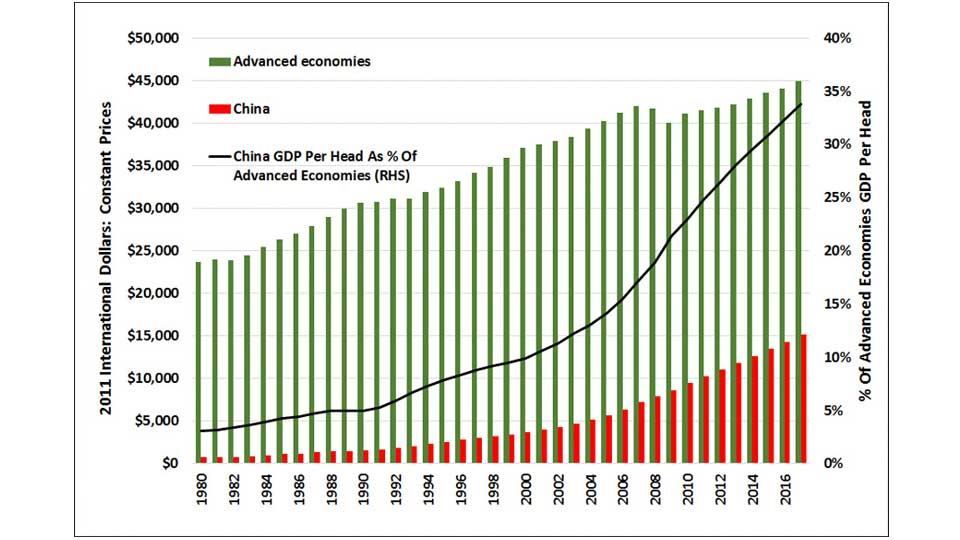
Source: IMF3 / Courtiers
In his classic 1932 work “Booms & Depressions”, economist Irving Fisher distinguished between productive and unproductive4 debt. In the lead-up to the 2007/2008 global financial crisis, banks were awash with “unproductive” sub-prime loans. There is no evidence to suggest that consumers in advanced economies are currently drowning in a sea of unproductive debt.
The main concern is borrowing in China. The Chinese authorities are trying to curb the expansion of credit, which is why the rate of increase of Chinese corporate debt has slowed down.
Only time will tell whether Chinese borrowing is sufficiently productive to allow China to service its long-term debts. So far, the evidence is that Chinese output per head is catching-up with the rest of the world (chart 17), although it still has a lot of catching-up to do.
Global debt may have risen in nominal terms (chart 1), but its rise relative to income (a more important measure) is quite modest post the global financial crisis (chart 2) and China is responsible for a significant proportion of the increase (chart 2). Government debt may have been on the increase but politicians have had to cope with a lot worse in the past (chart 13), meanwhile, UK families have had a bonanza of large increases in net wealth (chart 16).
On the most important measure of all, affordability, debt is easily serviceable (charts 11 and 12). Debt at current levels will remain affordable even after interest rates increase.
Central banks around the world have scope to increase interest rates without worrying about over burdening the private sector. That fact, along with rising inflation, is bad news for the price of long-dated bonds.