In a word, equities.
Of the two major asset classes, not only have equities historically delivered far greater nominal returns, but they have also provided superior risk-adjusted returns.
Over longer time horizons, the real return on equities is actually less volatile than the real return on gilts – an unintuitive result given we always think of equities as the riskier of the two asset classes.
These results are borne from our analysis of 118 years’ worth of annual UK returns data – much of it from the Barclays Equity Gilt Study. The chart below shows the annual returns on equities and gilts since 1900.
Annual returns on UK equities and gilts
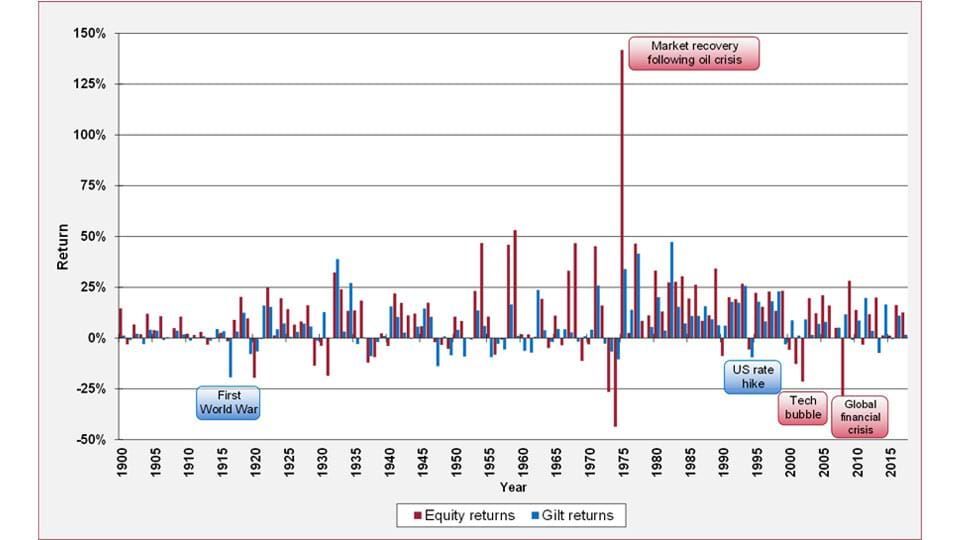
Source: Barclays, Bloomberg & Courtiers. The annual returns are total returns (i.e. they include income) and are denominated in GBP. Past performance is not a reliable indicator of future returns.
UK equities tumbled in 1974 as a result of the oil crisis, but recovered strongly in 1975 and posted a total return that year of +141.8%. More recently, the global financial crisis caused equities to take another hit, but since then they have generated a positive return almost every year.
The strongest period for gilts was the 1980s, where the annual return averaged +14.7%. The run of good gilt returns came to a halt in 1994 when the US rate hike sent bond prices tumbling.
The average returns and their volatility (standard deviation) are summarised below:
Mean & volatility of annual UK equity and gilt returns
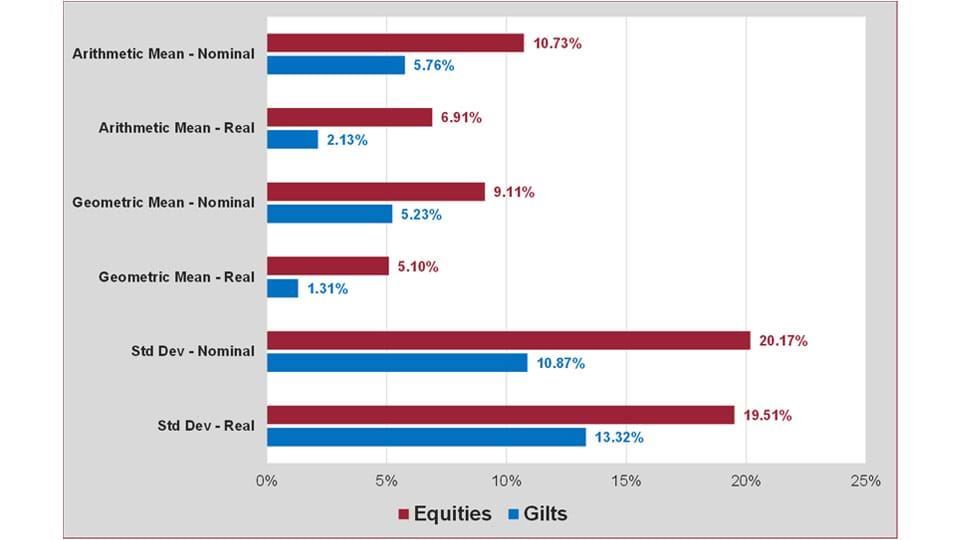
Source: Barclays & Courtiers. The annual returns are total returns (i.e. they include income) and are denominated in GBP. Real returns are adjusted for inflation. Arithmetic mean is a simple average, while geometric mean is a compound average. Past performance is not a reliable indicator of future returns.
Overall, annual equity returns have been greater than gilt returns, but have shown more volatility. However, when looking at real (inflation-adjusted) returns compared to nominal returns, the gap between the volatility of annual equity returns and the volatility of annual gilt returns shrinks.
If we extend the time horizon and look at rolling periods of more than one year then, when we reach eleven years and above, we get the surprising result that the volatility of real equity returns becomes lower than the volatility of real gilt returns:
Volatility and annualised real returns over various time horizons
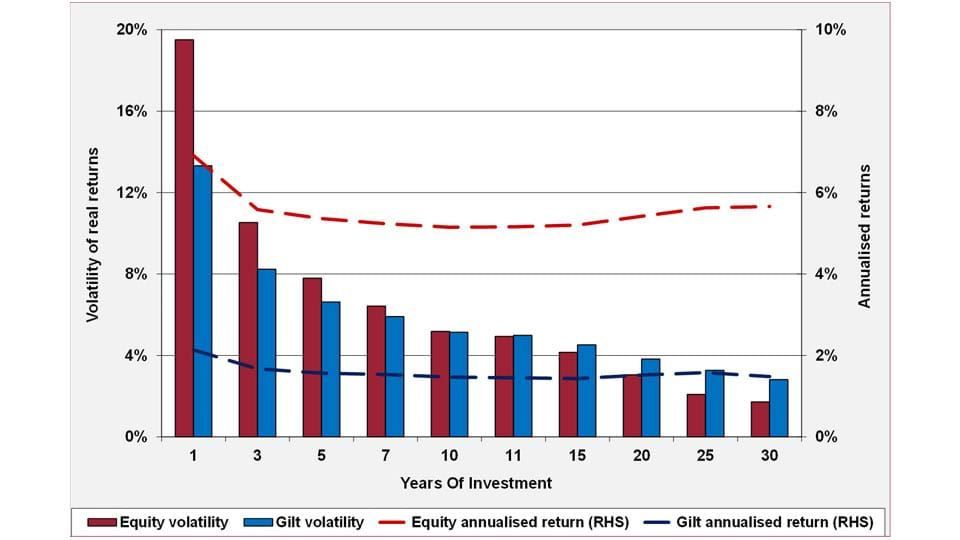
Source: Barclays & Courtiers. The annual returns are total returns (i.e. they include income) and are denominated in GBP. Real returns are adjusted for inflation. Past performance is not a reliable indicator of future returns.
This chart suggests that if you are investing for eleven years or more, then in real terms it is less risky to invest your money in equities than gilts. This is not intuitive, as we are accustomed to the notion that equities are the riskier asset class.
In practise, it is often sensible to invest in more than one asset class, as this adds diversification to a portfolio. If we add a portfolio comprising 50% equities and 50% gilts to the above chart, then we get the following:
Volatility and annualised real returns over various time horizons – featuring the Equity Gilt Portfolio
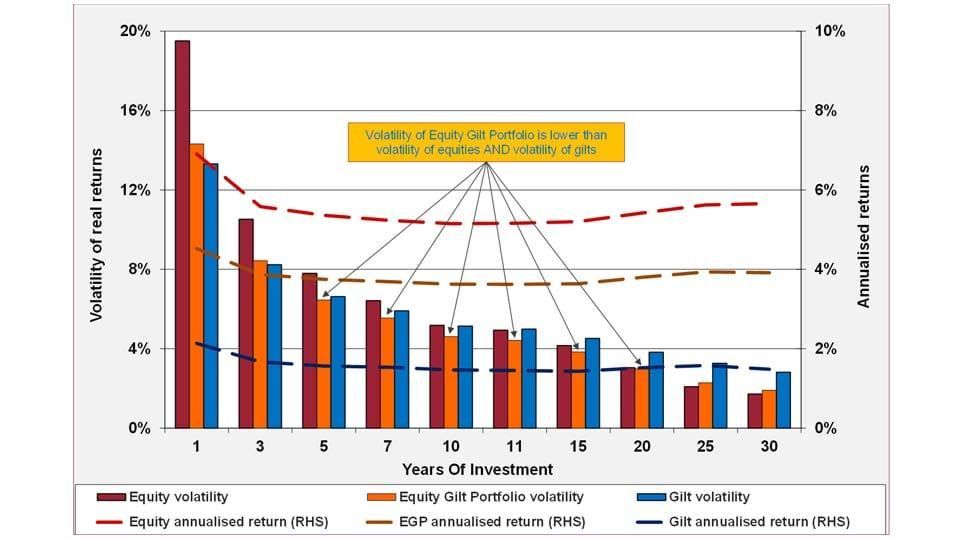
Source: Barclays & Courtiers. The annual returns are total returns (i.e. they include income) and are denominated in GBP. Real returns are adjusted for inflation. Past performance is not a reliable indicator of future returns.
Given the return and volatility of each of the three portfolios in the above chart, we can measure their risk-adjusted returns using the Sharpe ratio. As a reminder, the Sharpe ratio is calculated using the simple formula:
SR = rp – rf
op
Where:
rp = portfolio overall return
rf = risk-free return (e.g. the return on cash)
op = standard deviation of the portfolio returns
The results are in the following chart:
Sharpe ratios using real returns
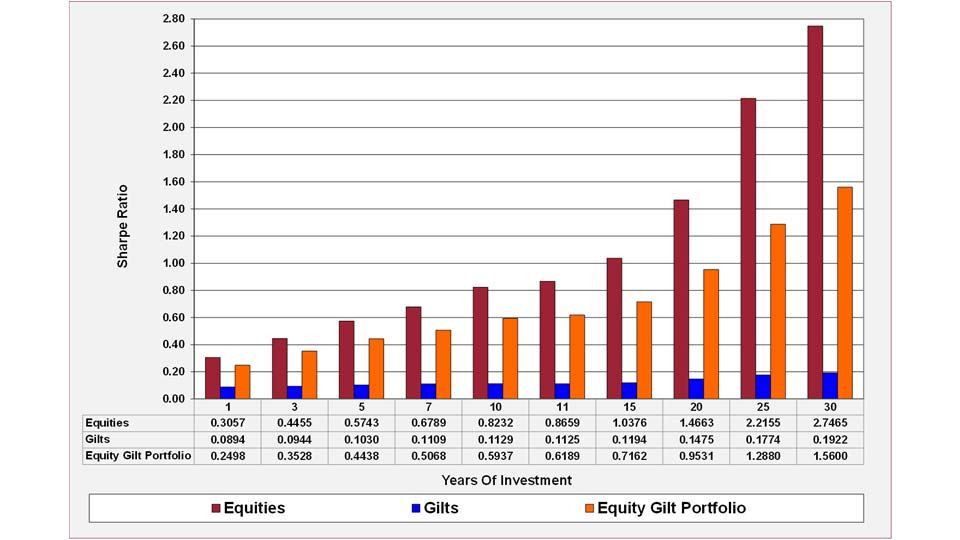
Source: Barclays & Courtiers. The annual returns are total returns (i.e. they include income) and are denominated in GBP. Real returns are adjusted for inflation. Past performance is not a reliable indicator of future returns.
Across all time horizons, equities are shown to have superior risk-adjusted returns to gilts. This is partly because gilt returns are often barely higher than the risk-free rate, which results in a very low numerator in the Sharpe ratio calculation. For the higher time horizons it is also because, as we have seen, long term volatility for real returns is actually lower for equities than it is for gilts.
The equity gilt portfolio also delivers far superior risk-adjusted returns to gilts, but despite this portfolio offering lower overall volatility in some time horizons, as seen in the previous section, it is ultimately equities which consistently provide the greatest return for their level of risk.
This suggests that equities, not bonds, should be the favoured of the two major asset classes. The third richest man in the world and widely regarded as one of the greatest investors of the modern age, Warren Buffett, said earlier this year that he would choose equities over bonds ‘in a minute’, and it’s not difficult to see why.
To read the full analysis, click here.