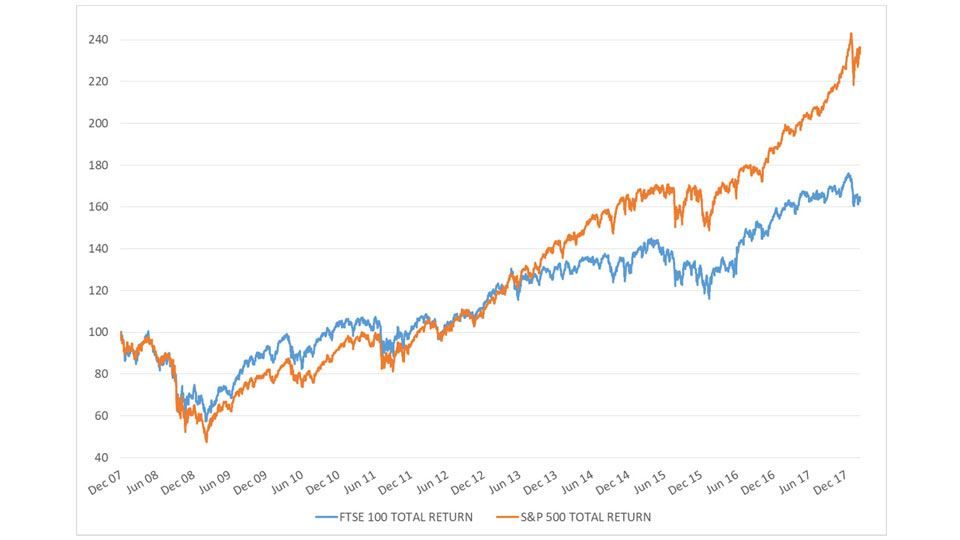
The S&P 500 has returned over double that of the FTSE 100 over the last 10 years. When translated into GBP, the effect is even greater, with the S&P returning 213% to the FTSE’s 61%. We have long been the beneficiaries of the outperformance of the US equity market, however, the persistent rise in prices has made valuations more expensive and other markets have become more attractive. We have begun to take profits on our US equity exposure and increased our exposure to UK equities.
This article examines the FTSE 100 index and the S&P 500 index – the flagship indices either side of the Atlantic. Both indices are in year 9 of the current bull market (this is a market in which share prices are rising) but the performance over this period has been markedly different.
Chart 1: 10 Year Total Return – FTSE 100 vs SPX 500
Source: Courtiers/Bloomberg
A recent global fund manager’s survey by Bank of America showed UK equities to be the most unpopular asset class amongst institutional investors. The consensus is that this is due to political uncertainty, however, it is clear that the trend started earlier than Brexit.
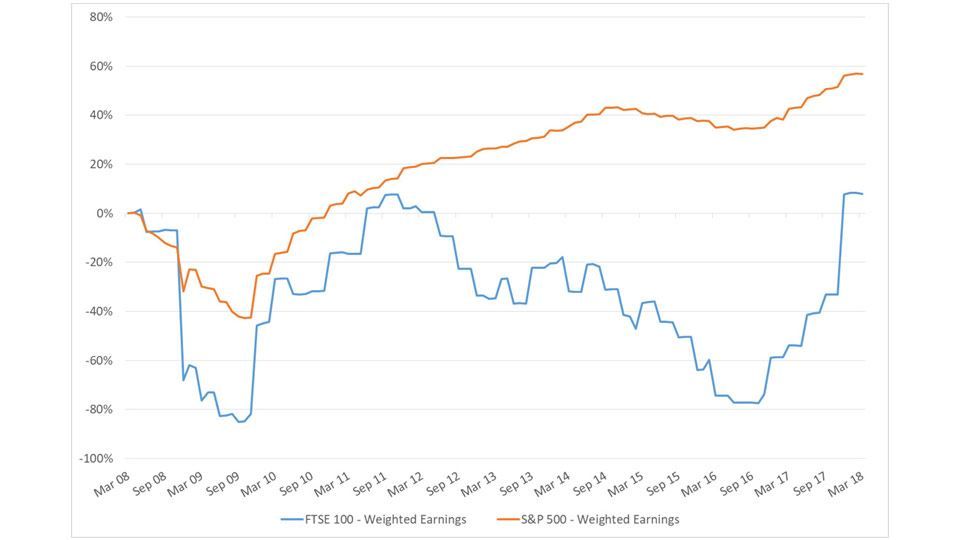
S&P fundamentals over the last decade have had a considerably smoother ride than those of their British counterparts.
Chart 2: 10 Year Growth in Earnings – FTSE 100 vs SPX 500
Source: Courtiers/Bloomberg
The above chart shows that earnings for companies within the S&P rose by 56%, whereas FTSE 100 companies’ earnings have risen only 8%.
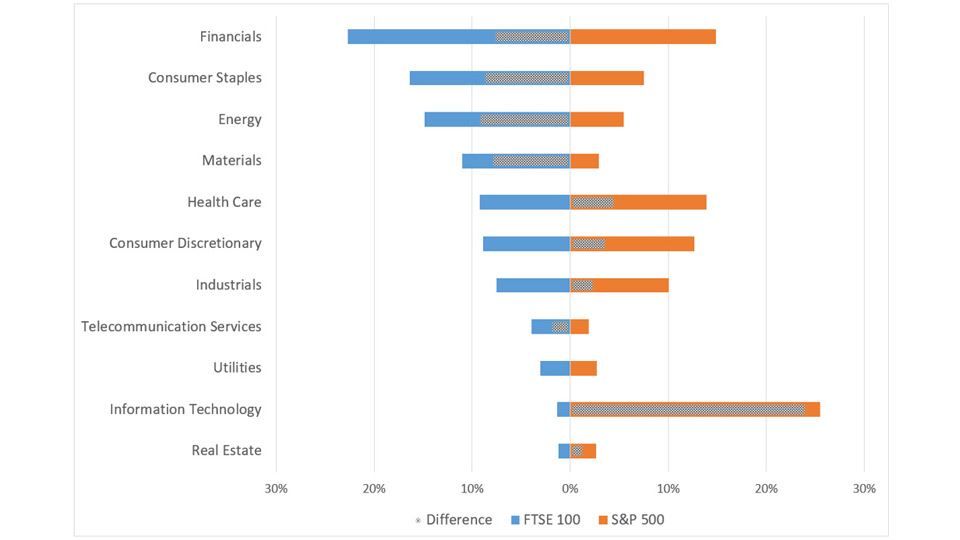
The difference has been driven partly by underlying performance, but a large contributor has been the difference in sector exposure.
Chart 3: Sector Exposures – FTSE 100 vs SPX 500
Source: Courtiers/Bloomberg
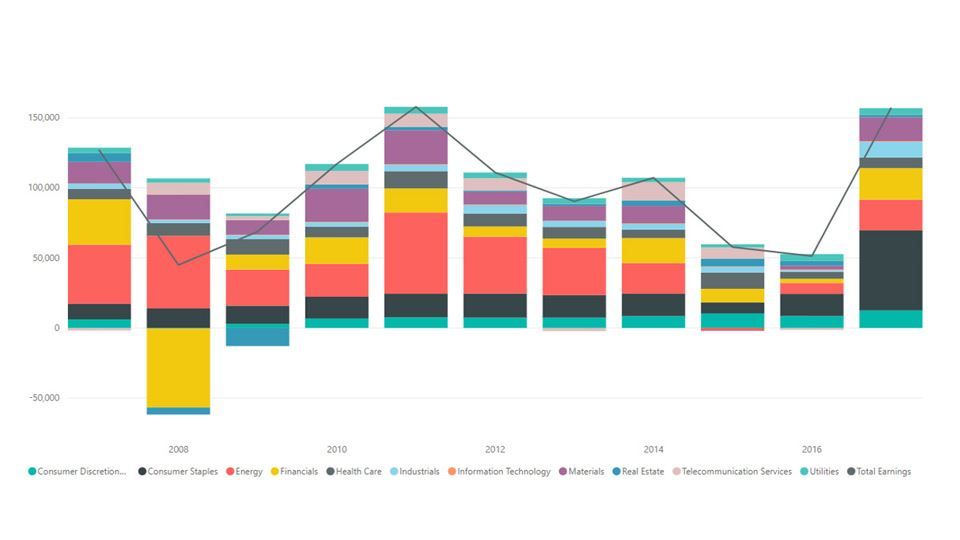
The FTSE has little exposure to Information Technology compared to the S&P 500 and more exposure to Financials, Consumer Staples, Energy and Materials. When we look at the contribution of the individual sectors to overall earnings we can see that these differences have meant earnings suffered more during the global financial crisis and again when commodity prices fell rapidly at the end of 2014. These were large events that had a disproportionate effect on the FTSE.
Chart 4: Sector Contribution to Earnings on FTSE 100
Source: Courtiers/Bloomberg
The FTSE is an unloved index right now, but we are seeing earnings stabilise and bank’s profits rise whilst the tough commodity environment has driven large efficiency gains in the Energy and Materials sectors. As Benjamin Graham said, “in the short run the markets are a voting system but in the long-run they are a weighing system”. To buy a position in US equity markets today you will have to pay around 21 times earnings, for the FTSE 100 you would only have to pay around 13 times.
P.S. Since the first Facebook sell-off on 16th March 2018 related to the use of data by third parties and subsequent attacks on Amazon’s tax affairs by the US President, technology stocks in the S&P 500 have fallen by around 8% and the FTSE 100 has outperformed the whole index by over 4%. The lower exposures to Materials, Energy and Financials may have benefited the S&P 500 in recent years but having 25% exposure to Information Technology is not always a good thing.


