On 11th May 1987, the Japanese telecommunications firm Nippon Telegraph and Telephone (NTT) – which listed on the Tokyo stock exchange earlier that year – reached a market capitalisation of over $350 billion, becoming the largest and most expensive company in the world.
If you had purchased a share on 11th May 1987 – chasing the heights of the Japanese stock market – in the five years that followed, you would have lost 85% of your investment. Plus, you would still be recouping your losses over 37 years later.
Fast forward to 27th March 2000. You’ve hopped on the bandwagon yet again, hoping to ride the heights of the US stock market, purchasing shares in the world’s largest company and the answer to the internet for years to come…Cisco. It has a market cap of $569 billion trading at 220 times earnings.
Unbeknown to you – and in a similar vein to NTT – the following year would see its share price plummet 83%. If you were still holding your Cisco shares today, you would have almost (but not quite) recouped your losses.
Hurt often comes with the pursuit of high gains in big and expensive companies. When companies with ballooning valuations look like the answer to an economic problem or when economies grow in an unsustainable manner, forming a bubble that could burst at any time, it equals toxicity for investors.
Cisco revolutionised how people live their lives, but, in late 2000 it was left with billions of dollars in unsold inventory as the demand for its equipment fell. While late 1980s Japan saw inflated real estate and stock prices, this overheated economic activity, coupling it with uncontrolled money supply, overconfidence and speculation. The latter had prominent characteristics of overvaluation. By August 1990 the Nikkei had lost half of its value and Nippon 75% of its own.
How is this relevant in today’s stock market?
In March 2000 the US stock market was heavily concentrated in a few stocks, with technology the most prominent. Cisco’s weight in the S&P 500 was 4.27%, followed by Microsoft at 4.22%. Other notable technology names were Intel with 3.72%, Oracle Corporation at 1.95%, and IBM with 1.78%. Seven of the ten largest names in the index were tech companies.
A commonly used measure of market concentration is the Herfindahl-Hirschman Index (HHI), which is the sum of the squared weights of stocks within the index1. The higher the HHI, the more concentrated the index in a few big names.
The HHI for the S&P 500 on the 27th of March 2000 was 127. The seven technology names in the top ten companies comprised almost 50% of that figure – a massive concentration.
Figure 1 below plots the HHI of the S&P 500 since 1990 in black. The red line shows the relative returns of the S&P 500 Equally Weighted Index (SPW) against the returns of the regular S&P 500 (SPX), which is weighted by market cap, and influenced by the changes in market concentration. An equally weighted index is not affected by changes in market concentration.
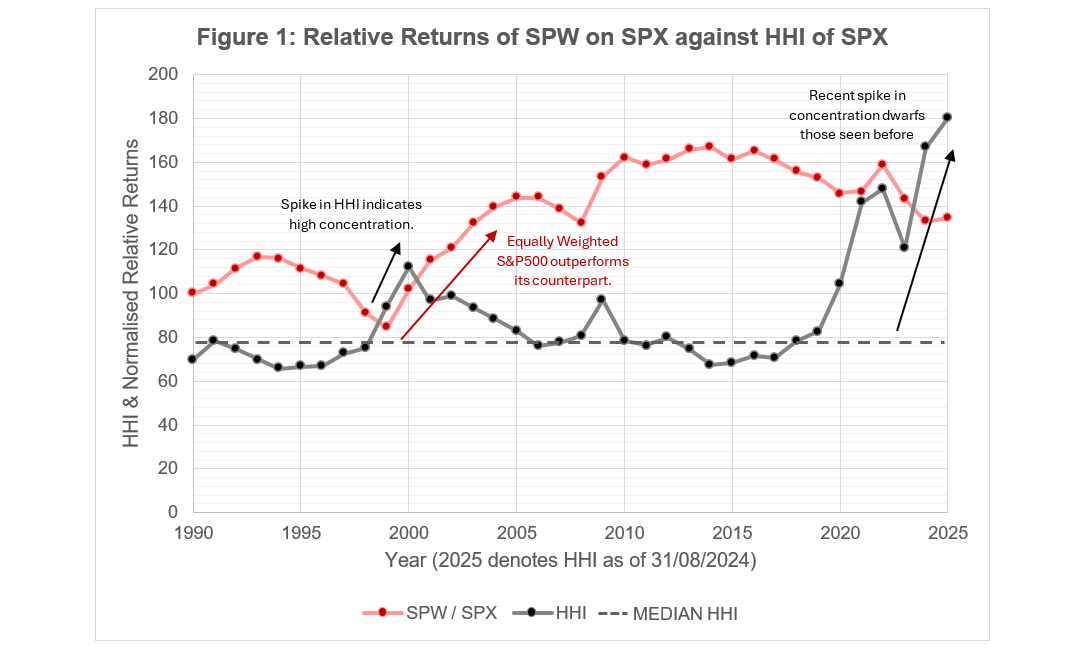
Figure 1 – Relative Returns of the S&P 500 Equally Weighted against the S&P 500 versus the HHI of the S&P 500 (Both measured as of 31st January, Yearly) Source – Bloomberg, Courtiers
The equally weighted S&P 500 holds all 500 companies at the same weight.
100% / 500 companies would mean each company is held at 0.2%. 0.22 x 500 = 20.
Therefore, the equally weighted S&P 500 always has a HHI of ~20.
In times where the HHI is elevated, it shows that capital is concentrated in a few large companies. Figure 1 shows an inverse relationship between the HHI and the returns from the S&P 500 Equally Weighted Index – with a focus on smaller companies. When the HHI increases or peaks it is followed by a relative outperformance of these smaller companies.
The most notable previous peak in concentration occurred in 2000 with the two lines crossing and was followed by outperformance of the Equally Weighted Index. A smaller peak in 2008 was similarly followed by the SPW outperforming.
Today we see an even bigger spike in the HHI. The current HHI is ~180, with huge concentration in Apple, Nvidia, Microsoft, and Amazon. The largest seven companies make up almost 30% of the whole index, contributing 150 alone to the overall index’s 180 HHI.
If history is anything to go by, then the two lines crossing signals doom for the big and expensive companies. Smaller, cheaper companies do better during these times.
We are open to holding better value companies, however timing the entry point is crucial. The Courtiers Multi-Asset funds acquired Cisco in 2020 and NTT in 2022, with both delivering returns of over 7% per year, showing that you can still make money from big tech provided you buy at the right price. This highlights the importance of not chasing performance but rather having a solid fundamental basis for investment decisions, and very strong nerves.

