The UK Government’s debt has ballooned since 1997, but should bond holders be worried? Gary Reynolds, Courtiers Chief Investment Officer, discusses how government debt and household savings are two sides of the same coin, with one balancing the sectoral spending of the other, before covering whether debt to GDP has any relationship to bond pricing.
UK government debt ballooned from £340 billion in 1997 to £2.82 trillion in 2024. That’s an increase of over 700%.
Chart 1 – UK Government Net Debt £ Trillions
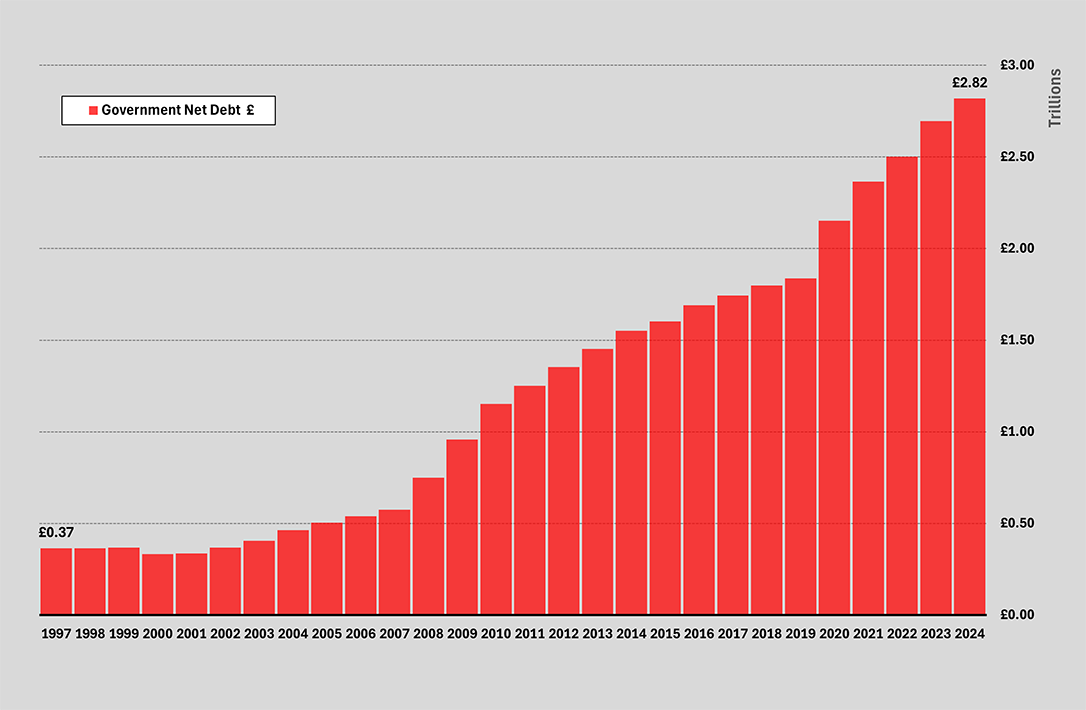
Source: ONS/Courtiers
Debt’s always the last government’s fault
Successive governments blame their predecessors for fiscal wastefulness and use this as an excuse to hike taxes and cut spending. In 2010, David Cameron’s newly elected coalition government played this card, and last year Labour claimed the Tories left them with a £22 billion public finances black hole.
Government deficits are only a balancing figure in a country’s sectoral accounts. Rachel Reeves must know this; she studied PPE (Philosophy, Politics and Economics) at Oxford, gained a master’s degree in economics from LSE (London School of Economics) and spent time at the Bank of England as an economist. George Osborne, architect of austerity for the Cameron government, could claim ignorance as he graduated with a degree in Modern History.
A big, fat zero
If you add up the sectoral financial balances across the government, households, corporations and overseas transactions, you get a big fat zero. Why? Because money sits on both sides of a balance sheet and one person’s asset is another’s liability.
Think of it like this: if you run a deficit in your personal finances, it means you’ve spent more than you earned. This gap must be filled by you borrowing from someone else. That’s only possible if the lender has a surplus.
The following chart shows the UK sectoral balances from 1987 to 2024. You can see the symmetry of this lending and borrowing through how the UK Government and Non-Government bars match – every deficit is matched by a surplus.
Chart 2 – UK Government and Non-Government Sector Balances as % of GDP
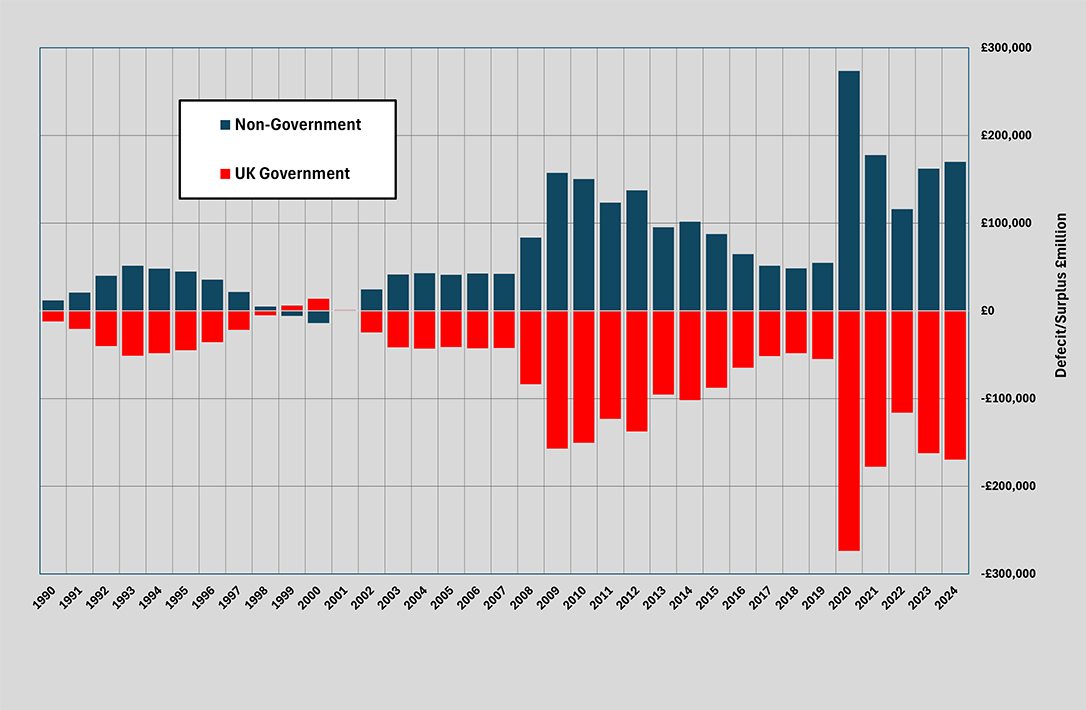
Source: Courtiers and ONS
The private sector boosted savings and ran large surpluses after the 2008 Global Financial Crisis (GFC), and then even larger surpluses as Covid-19 whacked the economy in 2020. Consequently, the UK government deficit rose post-2008 and then again in 2020. Unsurprisingly, as a response to GFC and Covid-19, households and those in the private sector paid down debt and increased their savings. Most people would think that was a good thing, but in doing so, the government had to run a deficit. For the private sector to persistently run a surplus, the government must persistently run a deficit.
Debt is not a bad thing
Continued rises in government debt are not a bad thing. As explained above, they are essential to allow the private sector to save. But many worry that debt interest and servicing costs squeeze the government’s ability to fund other services, and this is the core reason those favouring bonds think long-term interest rates will soar and push down gilt prices. If they are right, we should see a positive, historic correlation between long-term interest rates and government borrowing levels. No such relationship exists.
Chart 3 – Scatter-Chart: UK Government Bond Yields & Debt to GDP from 1707
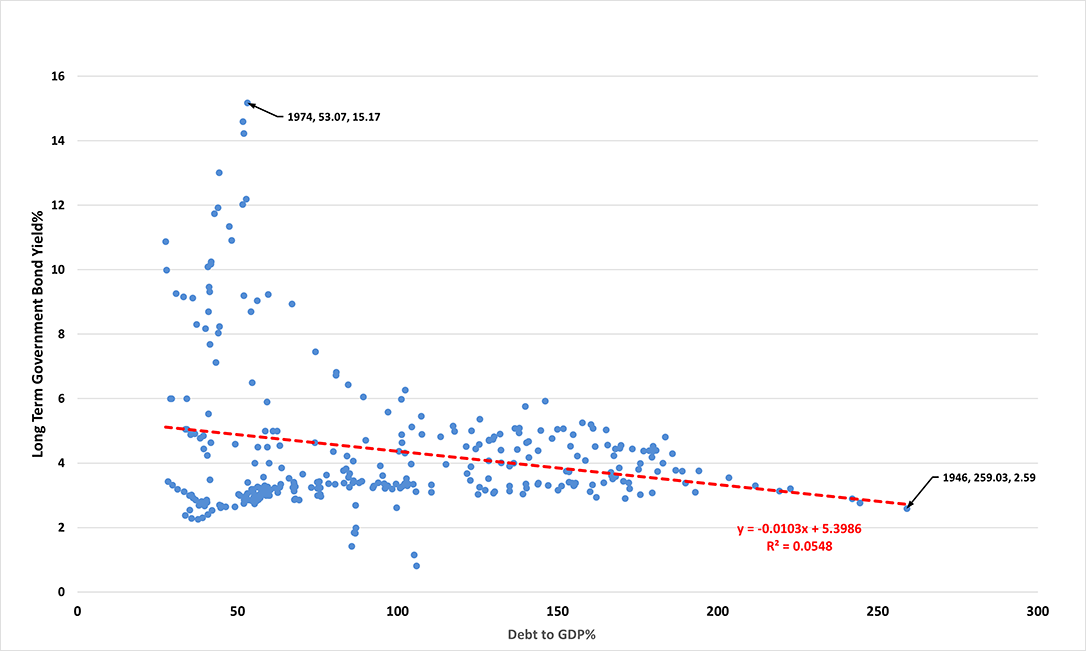
Source: Bank of England, Bloomberg and Courtiers
Chart 3 clearly demonstrates that higher government debt does not produce higher interest rates. In fact, the relationship is slightly negative, with interest rates running hotter when debt is low. When debt to GDP hit its 259% peak in 1946, long-term interest rates were a modest 2.59%, but when debt to GDP dropped to 53% in 1974, yields hit a record high of 15.17%.
Chart 4 further highlights this lack of relationship across a 300-year period.
Chart 4 – UK Government Bond Yields & Debt to GDP from 1707
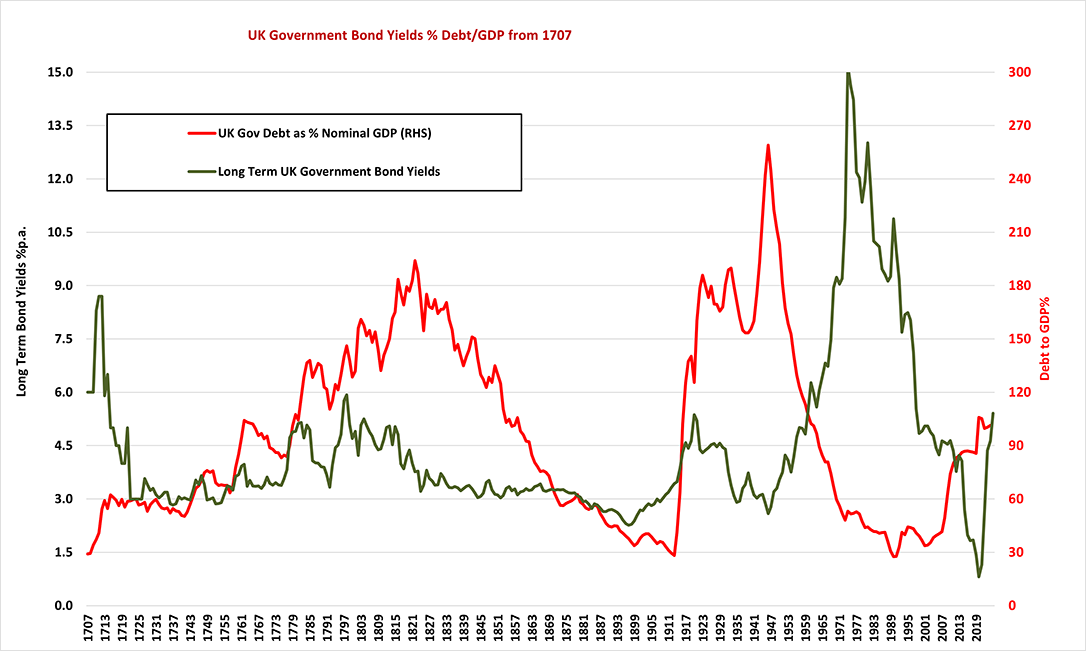
Source: Bank of England, Bllomberg and Courtiers
Debt won’t always rise
Just because the government constantly runs a deficit doesn’t mean debt-to-GDP will rise continuously, as highlighted by Chart 5, which shows the direction of UK government debt to GDP moving in trends that span multiple decades.
Chart 5 – UK Government Net Debt to % GDP from 1700
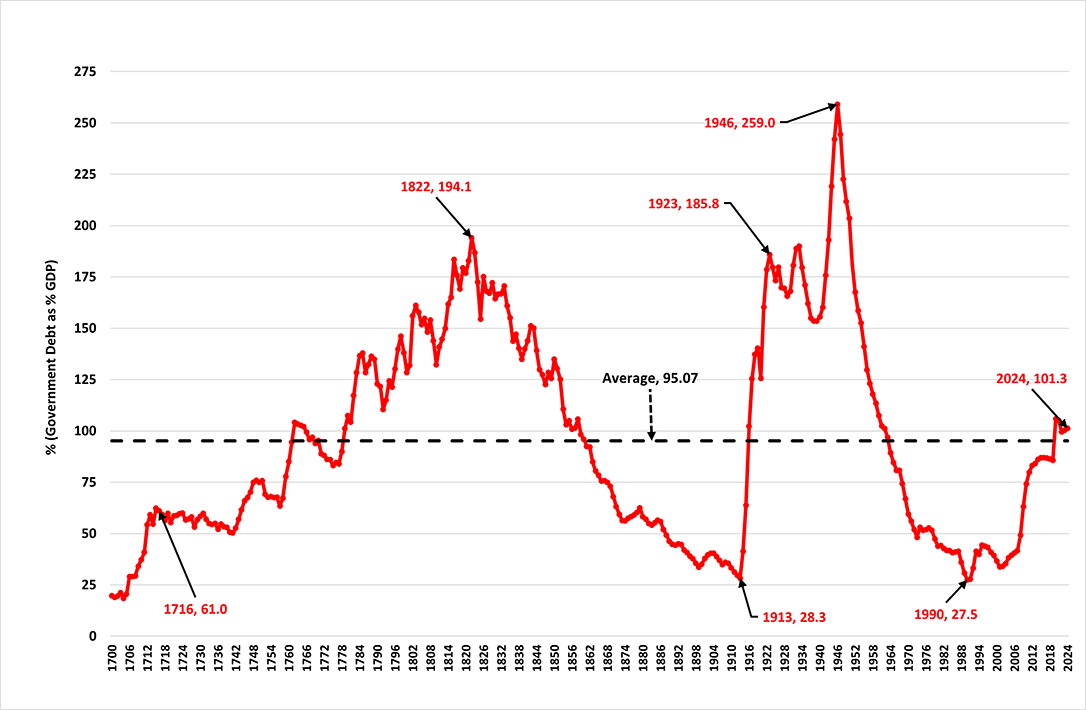
Source: Bank of England, ONS and Courtiers
Debt to GDP:
- Rose from 20% in 1700 to 194.1% in 1822
- Declined to 28.3% between 1822 and 1913
- Rose to 259% in 1946
- Declined steadily to 27.5% in 1990
 How does the public debt-to-GDP ratio come down if the government constantly runs a deficit? The answer is that it falls when nominal GDP (the denominator of the equation) rises faster than nominal debt (the numerator in the equation ). This happens in two ways, one good and one bad. The good way is through high levels of productivity, the bad way is via inflation.
The good way
Nobel prize-winning economist, Paul Krugman, said that “Productivity isn’t everything, but in the long run, it is almost everything”. Productivity improvements boost economic output, making everyone better off. Because it increases output, it can drive down government debt to GDP. This is what Rachel Reeves is hoping for, and why she is desperate to stimulate growth.
The bad way
The second way to reduce debt to GDP is via inflation, which increases nominal GDP. This eases the debt-to-GDP ratio. But it erodes the purchasing power of interest paid on bonds, as well as their maturity values. This means holders of gilts are losing out, to the benefit of the state. US President Ronald Reagan said: “make no mistake about it, inflation is a tax and not by accident”.
Unfortunately, in the post Global Financial Crisis era, decent productivity growth has eluded the UK (and, in fairness, most other developed economies too).
Chart 6 – UK Productivity % Annual Growth: 10 Year Moving Average

Source: Bank of England. ONS and Courtiers
Two sides of the same coin
UK productivity plunged after 2007. It is still depressed at just a smidgeon above the lowest point reached in 1893. This is not optimal for the British economy or the standard of living of those that work in it, but it shouldn’t cause concern among UK government bond holders. As highlighted in Charts 3 and 4, higher debt to GDP does not automatically result in lower bond prices.
High levels of household saving and large government deficits are two sides of the same coin. Like Frank Sinatra’s “Love and Marriage” you can’t have one without the other! The reason people worry about public sector deficits and their possible detrimental effects on gilt prices are twofold: firstly, because politicians accuse the incumbent government of recklessness, scaring the public, and secondly because lots of bond investors are still smarting from the August 2022 price collapse.
Yields are now comfortably ahead of their long-term average (unlike in 2022) and long-term bonds are a good risk diversifier for equities. This is why I am now more comfortable with including them in our funds and portfolios.