2016 was a good year for our investors, in fact it was a very good year. Returns from our multi-asset, risk controlled funds were as follows:
Fund / Return
Courtiers Total Return Cautious Risk Fund: 10.08%
Courtiers Total Return Balanced Risk Fund: 14.45%
Courtiers Total Return Growth Fund: 19.16%
Our UCITS (Equity and Bond) funds also did very well:
Fund / Return
Courtiers Investment Grade Bond Fund (IShares): 8.64%
Courtiers UK Equity Income Fund (IShares): 14.13%
Courtiers Global (ex-UK) Equity Income Fund (IShares): 35.28%
With UK CPI inflation at just 1.2% in 2016 (source: ONS, year to November 2016), we delivered strong “real returns”1 for all our mandates maintaining, and increasing, the purchasing power of our clients’ capital. Can we do it again in 2017?
Forecasts For 2017
Five years ago we built a new model for analysing the fundamentals of major equity indices and predicting 10 year returns based on Adverse, Mediocre and Positive scenarios. The Adverse scenario seeks to roughly replicate the effects of the global financial crisis of 2008, with corporate earnings (profits) falling by -50%. The Mediocre scenario assumes a modest decline in earnings (-10%) and the Positive scenario assumes no immediate changes in earnings or dividends, but with book values rising by 10%, and earnings and dividends growing by 10% pa in the subsequent nine years.
Charts 1 and 2 show the forecasts for future returns from the FTSE 100 index and the S&P 500 index, under each of the three scenarios, in December 2011 and December 2016.
Chart 1
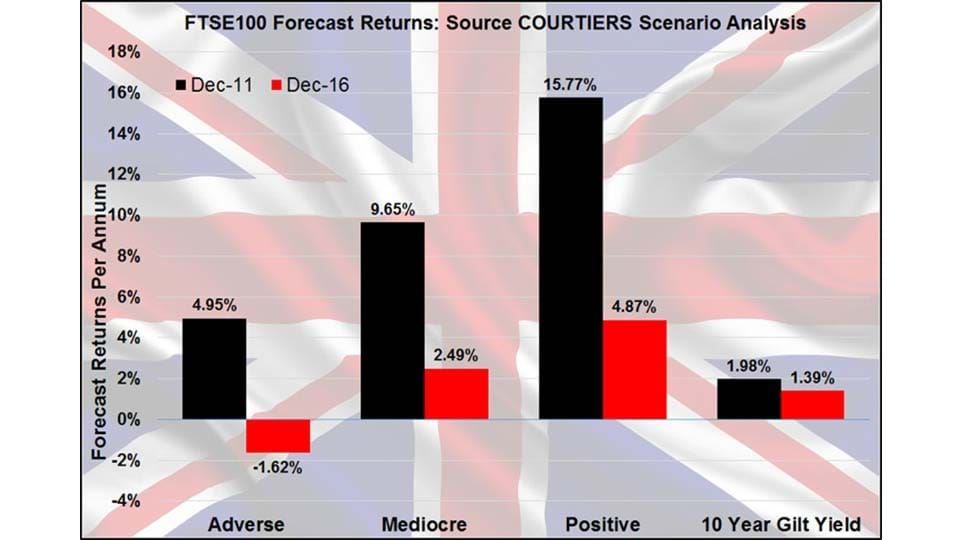
Chart 2
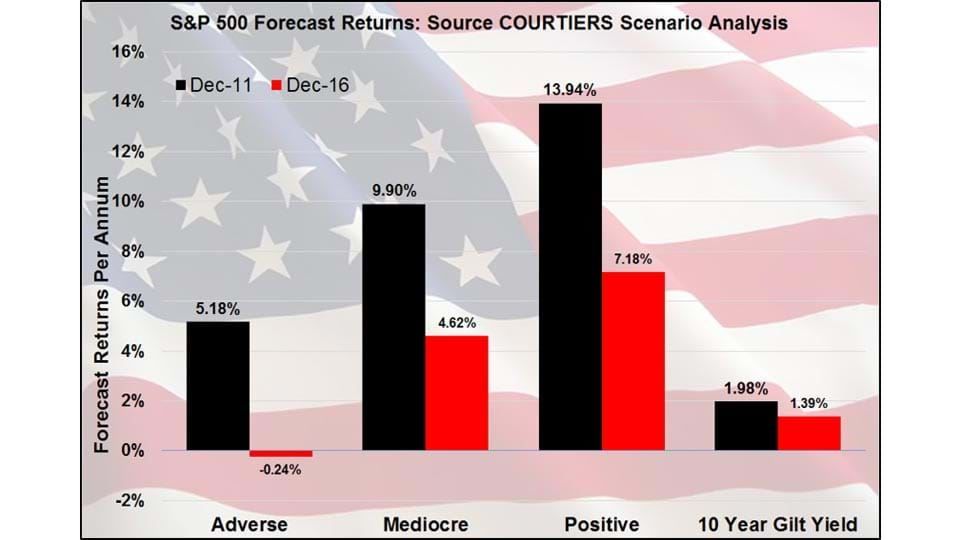
In December 2011 the Adverse scenario (an immediate repeat of the 2008 global financial crisis) still offered an average 10 year return that was significantly higher than the 10 year return from UK gilts. This is not the case at December 2016 where, despite the 10 year gilt yield dropping from 1.98% pa to 1.39% pa, returns under the Adverse scenario from the FTSE 100 and S&P 500 are both negative at -1.62% pa and -0.24% pa respectively. Forecast returns from the Mediocre and Positive scenarios have also declined significantly, although both offer better prospects than gilts. The reason for the change in forecasts over the last 5 years is the strong recovery in equity prices. It is unlikely shares will repeat this extraordinarily strong performance over the next 5 years.
Another basis of estimating future equity returns is to use the classic Gordon’s Growth Model2. Chart 3 shows the forecast future equity returns, using the MSCI World index, in December of each of the last five years.
Chart 3
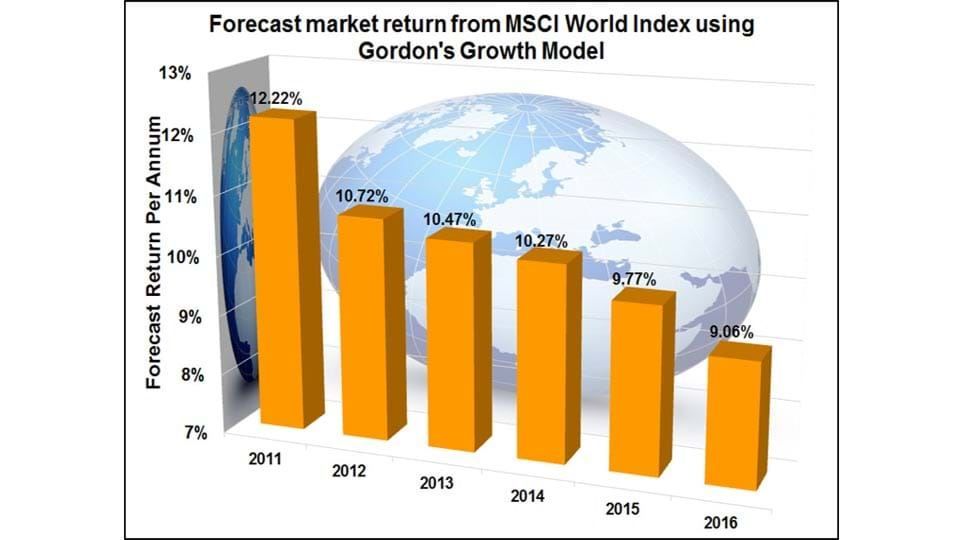
Estimated future global market returns have dropped from 12.22% pa in December 2011 to 9.06% pa currently. The difference may appear marginal, and 9.06% pa still looks like a very good long-term return, especially compared with current interest rates. But the difference in total expected returns is enormous. £100,000 growing at 12.22% pa (the December 2011 forecast) becomes £1,003,241 after 20 years. At the current 9.06% pa, the figure is much lower at £566,643.
Fundamentals from global equities are also less attractive than they were five years ago. The widely used PER (Price Earnings Ratio) was just 11.59 in December 2011. Today it is 18.06. The P/B (Price to Book) ratio was 1.64 in 2011, today it is 2.16. Dividends are lower too: 3% pa in December 2011 compared to 2.5% pa today. In short, the equity market is less attractive than it was in December 2011. Does that make equities expensive?
Although equities may be costlier than they were at the end of 2011, they are still relatively cheaper than they were in December 1999 at the peak of the tech bubble. One could say that equities are both cheaper and more expensive depending on your starting point.
Perhaps a better way of asking the question “are equities expensive?” is to consider the alternatives. After all, if someone sells their equities the money has to go somewhere.
The asset class that looks most expensive is bonds. The fixed return on 10 year gilts (UK Government Bonds) is just 1.388% pa. It is not much better over 30 years where the yield is 2.029% pa. There is very little compensation, for the long-term bond investor, for the risk they are taking that inflation will erode, perhaps dramatically, the purchasing power of their capital.
Index-linked gilts aren’t much better. Ten year issues provide a yield of –1.868% pa, and the 30 year issue –1.510% pa. In other words, the government gives you a cast iron guarantee that your money, at maturity, will buy less than it does today.
How About Property?
Rental yields on UK residential property are currently around 5% pa. Remember, with residential property the responsibility for maintenance of the building rests with the landlord (the vast majority of leases are not full repairing in the residential sector). This means that you have to allow for repairs to be paid from income. Rents also have to be collected, agent’s fees paid and void (unoccupied) periods allowed for. In most cases, this makes the investment uneconomic in the absence of capital growth which, of course, every home-owner is hoping for. But growth is not guaranteed, and if the economy stalls and families become concerned about the possible outcome of a “hard Brexit”, then residential property prices may stagnate, or even decline.
Commercial property generally provides for the occupier to be responsible for the cost of repair and dilapidations and the yields are often much higher than those available in the residential sector. However, for most people commercial property is too costly. Even if you have £5 million kicking around, and you do find a decent property for this price, you will have little diversification, so you will be relying on a favourable outcome from the type of property you have chosen, the area in which it is situated and the ongoing quality of the tenant. Personal direct investment in commercial property is the prerogative of the mega-rich.
So back to the original question, “are equities expensive?”. They are more expensive than they were five years ago, less expensive than they were 17 years ago, and generally still better value than bonds, property and cash.
For the longer-term investor, equities offer higher prospective returns, better protection against inflation and more liquidity than other asset types. In return for these improved longer-term prospects, equity investors have to accept short-term fluctuation in prices (volatility) and the risk that some companies could go bust entirely (which is why broad diversification is essential).
I don’t think the prospects for equities over the next five years are as good as they were in 2011, but share values are not expensive, and for the long-term investor equities offer better opportunities than most other asset classes.