“But as the Chancellor set out last week, just 5% or less of UK pension assets are invested in the UK economy – far less than in other countries.” – Nikhil Rathi, FCA Chief Executive, 13th March 2024.
Money leaving Britain in recent years has led to a huge valuation differential between the UK market and its global counterparts, particularly the US. This may sound bleak, but it presents a significant opportunity.
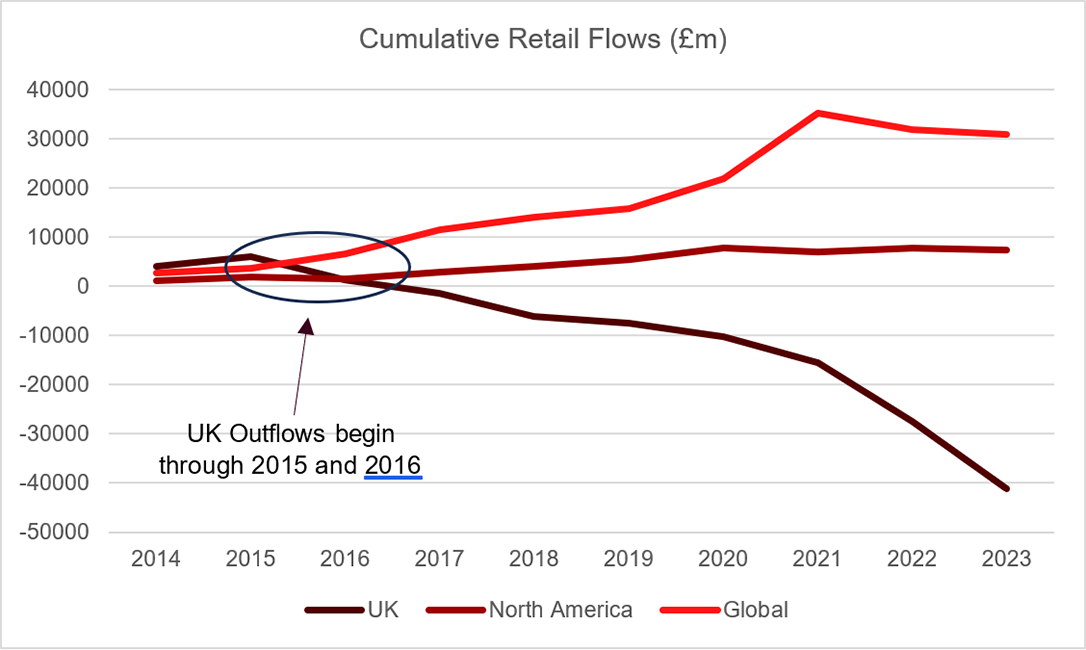
June 2016 saw the UK vote to leave the EU, and capital subsequently left the UK. Cumulative flows, (see below) show a huge dislocation in capital exiting the UK market from 2016 onwards, while capital flowed freely into Global and US funds. Over £40 billion has left UK retail investment funds in the last seven years.
Source: Investment Association
These outflows have exacerbated disparities in companies’ valuations across regions. The FTSE All Share is an Index comprised of ~600 companies listed on the London Stock Exchange; the S&P 500 index contains the largest 500 publicly traded companies in the US, whilst the MSCI World contains ~1,500 large- and mid-cap companies across 23 developed markets.
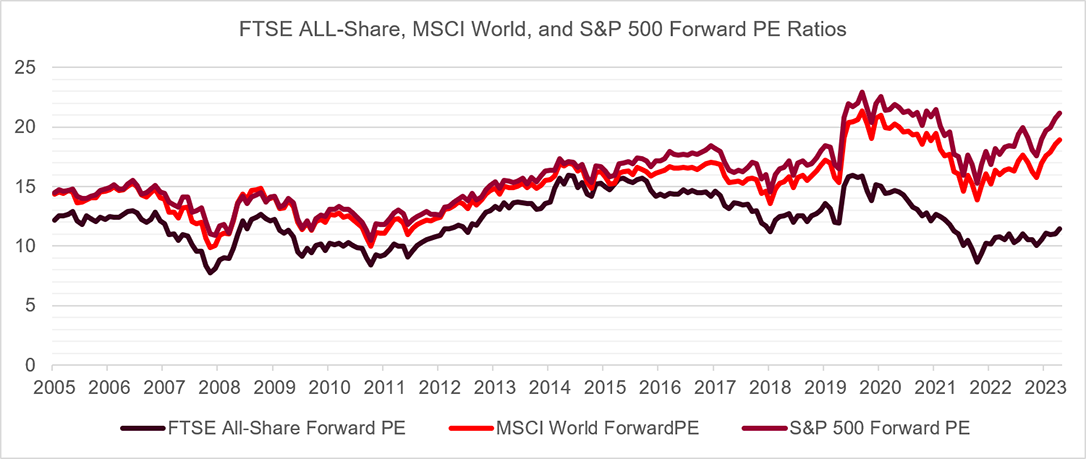
When comparing company values, a common multiple used is Price-to-Earnings (PE), which in layman’s terms captures the amount you pay for a company’s shares relative to the earnings (profits) you receive. The below chart displays the PE ratios of the FTSE All-Share, S&P 500 and MSCI World Indices, using ‘forward earnings’ – earnings expected over the next twelve months. The S&P is expensive relative to the FTSE, and the effect of its ~60% dominance within the MSCI World can be clearly seen to drag the Global index upwards too.
Source: Bloomberg, Courtiers
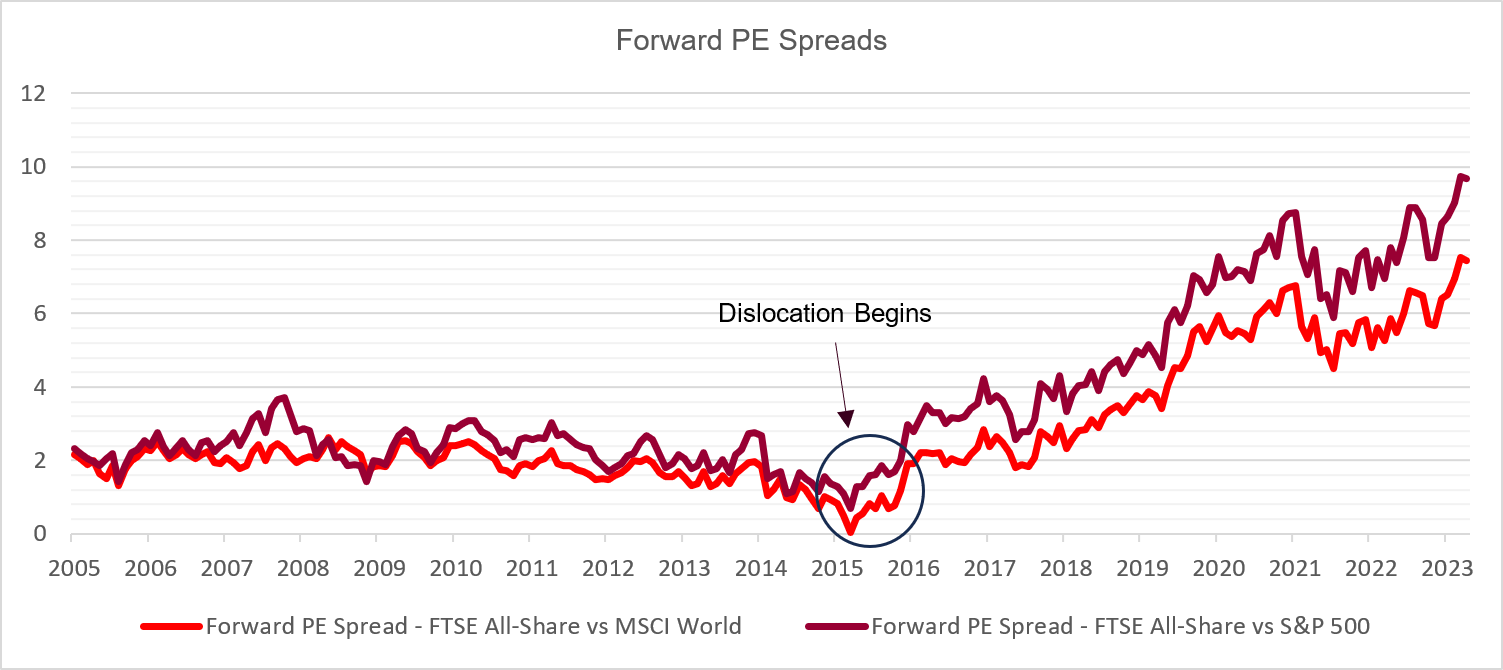
When looking at the spread between the indices, which is simply one minus the other, we can see that the valuation of the S&P 500 has become elevated post-2016 when the dislocation following Brexit began.
Source: Bloomberg, Courtiers
The disconnection between the UK and the S&P and MSCI Indices post-2016 creates a further facet to the UK opportunity with respect to capital scarcity. Capital scarcity causes a mismatch between supply and demand, and investing where capital is scarce can often produce the highest returns. Investing in undervalued, unloved companies, where capital investment is lacking because of significant outflows over consecutive periods can present very attractive opportunities.

This scarcity of capital is displayed by the declining weights of UK companies in the MSCI World Index. Although these weights have been coming down for many years, the decline has accelerated post the Brexit referendum, as displayed by the higher negative compound annual growth rate in the left-hand table below.

Source for both tables: Bloomberg, MSCI, Courtiers
The right-hand table, which displays the absolute change in size of the geography within the MSCI world, evidences the fact that post-2016 the US has become doubly expensive versus the UK market.
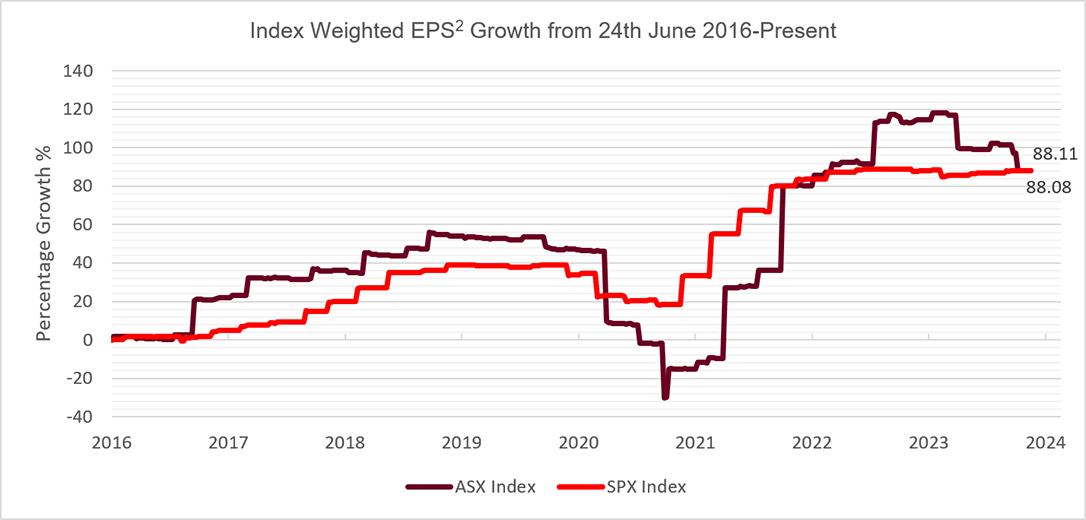
In fact, since the date of the Brexit referendum the FTSE All Share has returned ~80% versus the S&P 500 which has returned ~220%, over 2x that of the UK Index. However, the earnings of each index, which comprise the denominator of their PE ratios tells a different story. Earnings growth from the day after the referendum has been almost identical for both Indices, as highlighted by the below chart, which shows that from the date of the referendum, UK earnings have not slipped, but confidence in Britain’s market has.
The huge outperformance of the S&P 500 is not backed by higher earnings growth, and as a result US companies have become expensive relative to their UK counterparts, which have, despite Brexit and uncertainty thereafter, maintained impressive growth in profits.
Source: Bloomberg, Courtiers
The deluge of money out of UK markets, and the disparity in company valuations poses the question as to when the UK market will become cheap enough to stimulate capital inflows. Articles with titles such as ‘UK stocks – too cheap to ignore?’ (IG UK), and ‘I ignored the Budget but love UK stocks regardless’ (FT), indicate that sentiment may be shifting.
Recently, cheap UK firms have become targets for acquisitive overseas companies, with a buyout offer for London listed miner Anglo American being a recent example. Since the turn of the year, we have seen offers for network testing firm Spirent from US-based rival Viavi solutions at a ~60% premium. Direct Line Group rejected two offers from Belgian firm Ageas at a near 40% premium. Logistics firm Wincanton ended up achieving a ~100% premium following two offers from a US firm. These evidence the low valuations of UK firms and signal changing views.
The valuation discrepancies are also highlighted by looking at individual sectors within the Index. Integrated Oil companies, a segment within the UK Energy Global Industry Classification Standard (GICS) which includes Shell and BP, has a PE ratio of ~12.1x, while in the US, the same segment including Exxon Mobil and Chevron, has a PE of ~14.7x. It is a similar story in the Large Pharmaceutical segment, where the FTSE has household names GSK and AstraZeneca and a PE of ~27.2x. S&P Large Pharmaceuticals includes Eli Lilly, Pfizer, Merck, and Johnson and Johnson, and has a PE of ~69.3x, over twice the cost of their UK counterparts.
Although valuation premiums can sometimes be explained by differences in scale and returns on capital, these likely do not tell the whole story, and the out of favour UK market may lay claim to some of the blame. All the firms mentioned have decent returns on investment and are all of significant scale, thus the discrepancies in valuation are likely the result of capital leaving an out of favour UK market, not underperformance by the companies themselves.
The UK market has become undervalued and at current prices it offers phenomenal value, especially compared to pricey US stocks. It’s time to back Britain!


