Just after Christmas I wrote that the last month of 2018 may prove the worst December for the US stock market since the Great Depression of 1931. In the end, the S&P 500 (the index of America’s largest quoted companies) did a little better than its previous record loss for December (-14.53%), but it is still the second worst on record (-9.18%).
Shares on both sides of the Atlantic lost money in 2018 which, as I mentioned at our Client Seminar a few weeks ago, happens on average around one in every four years. This risk of losses is the price that equity investors pay for the prospects of long-term returns that are generally better than those from bonds or cash.
Although equity prices fell last year, earnings (company profits net of tax) did ok.
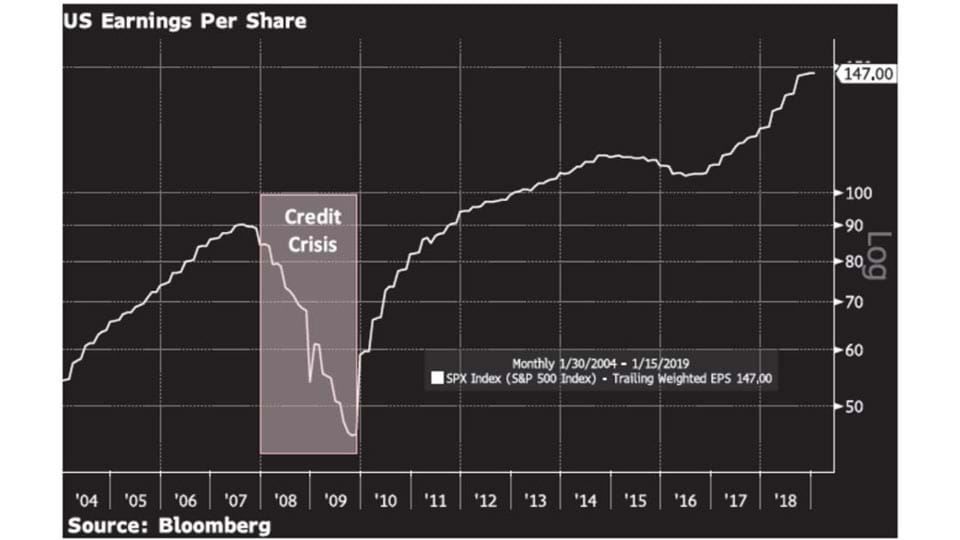
Chart A: US S&P 500 Index – Earnings Per Share
Past performance is not a reliable indicator of future returns.
Chart A shows earnings plummeting during the credit crisis but growing subsequently, and they continued to rise in 2018.
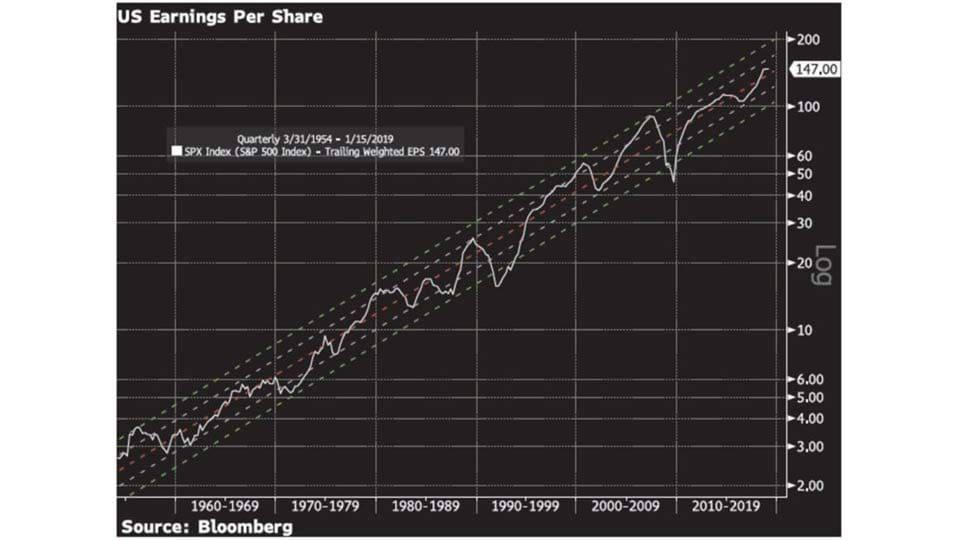
To put this in a longer-term context, Chart B shows the rise in earnings from S&P 500 companies since March 1954.
Chart B: US S&P 500 Earnings Per Share and Trend Lines from 31st March 1954
Past performance is not a reliable indicator of future returns.
The solid white line shows actual earnings per share. The dotted lines show the long-term trends. The red dotted line is the average, and the white and green dotted lines represent standard deviations from the average.
The chart is interesting because it shows earnings way above trend just before the tech bubble burst and again in 2007 before the global financial crisis. The current level of profits per share is around trend.
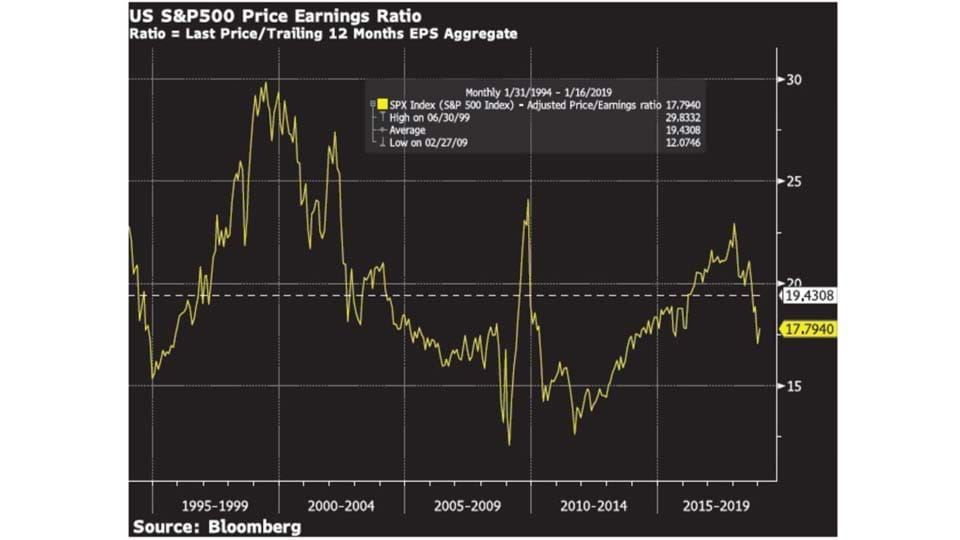
One of the most popular measures of fundamental value is the price/earnings ratio (PER), which divides the value of shares (their price) by their net profits (their earnings). The ratio indicates the amount that an investor is prepared to pay for each dollar of net profit that a company makes, which is why a lower PER indicates better value than a higher PER.
Chart C: S&P 500 Index – Price Earnings Ratio
Past performance is not a reliable indicator of future returns.
Due to the decline in share prices, the S&P 500 PER has fallen to 17.79, which is below its 25 year average of 19.43. On this measure, US stocks are not over-valued.
If you invert the PER (i.e. swap the numerator with the denominator), you get the earnings/price ratio, which is also known as the earnings yield. The current earnings yield is 5.62%, which seems pretty reasonable when investors consider that the fixed rate of return from 20 year bonds is 2.9% p.a. in the US and 1.7% p.a. in the UK.
The relative attractiveness of the earnings yield from equities compared to the fixed return from long-term bonds will govern the movement of stock market prices during 2019. If the gap closes because either a) interest rates go up, or b) earnings come down, then shares will have a poor year. If, however, the US Federal Reserve Board (the Fed) decides that interest rates are now high enough and so makes no further hikes, and if company profits can at least be maintained at current levels, then shares will likely have a good year.
Twelve months ago 2018 opened with high expectations for above-average economic growth in the US, rising employment and improvements in productivity in Europe and North America. Alas, Trump’s tariffs hit China’s economy hard, global growth faltered, and the threat of an escalation of geopolitical tensions un-nerved markets. At home, UK investors became increasingly nervous as a no-deal Brexit looked ever more likely.
In contrast, 2019 opened pessimistically with concerns about the shut-down in the US government, stalling economic growth, debt problems in China and the possibility of the UK crashing out of the EU with negative consequences for the economies on both sides of the English Channel. These worries have made share prices cheaper, which has improved investment fundamentals. This is why we have been dipping our toe in the water to rebuild equity exposure which, as Courtiers investors will know, we reined in last year.
I don’t think this is a time for unbridled optimism, but neither do I think that investors should be unduly pessimistic. It is always best to adopt a pragmatic view of what returns are available on your capital, and right now, equities are offering much better long-term prospects than bonds.