The US yield curve has inverted, a phenomenon that has preceded each of the USA’s last seven recessions. Is this the dead canary in the mine warning of bad things to come? Or is this the second time in the last half century that the inversion gives a false signal?
With its reputation for ocular excellence, the yield curve is frequently cited as the harbinger of financial doom. Gary Reynolds explains the yield curve and how it works.
What is the yield curve?
I’ll explain with a simple example: You’ve known your neighbour for years. One morning, she knocks on your door and tells you she can buy a car for cash at a rock bottom price. She’s given notice on her seven day deposit account but the money isn’t available for a week, so she asks to borrow £10,000. You’ve never had reason to doubt her family’s honesty or integrity…the money’s sitting in your current account…so you say yes and while you’re the generous type and don’t expect interest, your neighbour insists. The compromise is that the money returns a few days later together with a very nice bottle of Balvenie DoubleWood 17 Year Old single malt.
Let’s change the circumstances a little and test your generosity further: Your neighbour’s short-term cash is not on seven days, but now 180 so she asks to borrow £10,000 for six months. You can help, but you’ll need to take the money from your instant access deposit which will cost you interest. Do you accept your neighbour’s offer to pay you a decent 2% per annum interest and lend her the money?
Let’s turn the wick up higher: Your neighbour desperately needs a new car because her old one’s conked out. She’s short of cash and recalls you moaning about the pitiful rates you were getting on your deposits, so wonders if she could borrow £10K for five years and pay you a high rate of interest. I guarantee that you’ll feel very queasy about lending to your neighbour over five years, after all:-
- Your neighbour may have bad luck in the five year period and be unable to pay you back.
- You may need the money urgently.
- Your neighbour has offered to pay you a fixed rate, but interest rates may rise.
Congratulations! You’ve just created your own yield curve. You were prepared to lend at a low rate for a week, more for six months, and a much higher rate for five years.
If we have enough examples of loans being made from one person to another, on fixed rate terms over a variety of years, then we can work out what the going market rate is for any period. Of course, we are not quite sure how credit-worthy each of these borrowers are. You may be prepared to lend money to your next door neighbour at a much better rate than your neighbour two doors down. That distorts our data, but if we can find a borrower that’s completely trustworthy and who borrows money over every possible period, then we would be able to see clearly what the market rate was for any term. Eureka! That’s exactly what the US and British Governments do when they borrow money in the form of T-Bills or fixed rate bonds.
Are there any circumstances where you would lend money to your neighbour over five years at a lower rate than you would over one month?
Actually there is one, and it’s when you think the short term rate will fall. So when your neighbour repays you one month later, the market interest rate will have dropped by such an extent that the five year rate today would be much higher. When this happens it’s called an “inversion” of the yield curve and it’s thought to be an indicator that the economy is about to go into recession.
The US yield curve has inverted for the ninth time since 1968 (see chart 1), and on seven of the previous occasions this presaged a recession. Bad news sells better than good news so the media loves a story about impending doom, but before you trouble yourself with needless worry and sleepless nights, let’s look at the current environment and how the mechanism of inversion occurs, and is remedied.
Chart 1 – US Yield Curve @ 31st July 2019
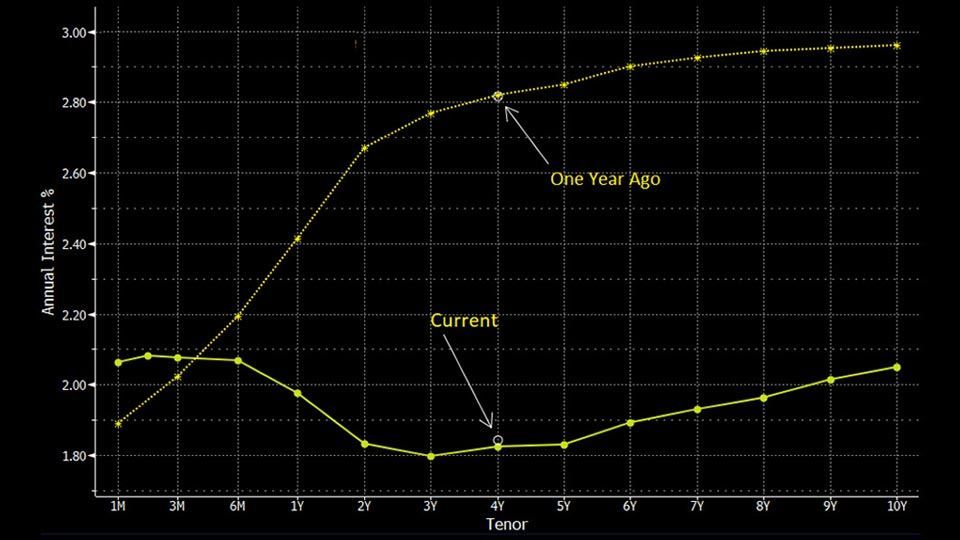
Source Bloomberg & Courtiers
The “Fed” (The Reserve Board, the US Central Bank) controls interest rates with the intention of keeping inflation at around 2% per annum and maximising job creation in its home economy. When the Fed thinks the market is overheating it starts increasing interest rates to stop consumers spending too much. As their spending eases, the economy slows down. Historically, the Fed has been reactive and waited for evidence of an economic slowdown before cutting interest rates. The market is proactive and anticipates a Fed rate cut long before it happens. When this occurs, longer term rates fall whilst the short term (base rate) remains high and the yield curve inverts. This is what is happening today.
As an economic slow-down/recession bites, the Fed will drop interest rates to stimulate recovery. This is good news for borrowers who see the costs of servicing their debts fall.
Outside of the US, the yield curve is a pretty poor predictor of recessions. The fact that short term interest rates are higher than long term rates doesn’t mean a recession is a done deal. The financial sector uses hundreds of indicators to try and predict the direction of the economy and the future value of a wide variety of financial assets. None are reliably prescient.
Although the economic recovery in the US (and UK) is one of the longest in history, it’s also one of the shallowest. There has been no major bounce back from a devastating 2008 recession and productivity improvements have been absent (something I talked about at our Client Seminar in December 2018. If the economies either side of the Atlantic stall then central banks will respond with interest rate cuts and a return to QE (quantitative easing). For this reason, stock markets won’t necessarily follow economies into recession.
Fear not
Periods of high political uncertainty are unnerving. The fact the major economies of the world and their stock markets have been on a virtually uninterrupted upward march for a decade adds to the apprehension, but the conditions are not all bad. Many businesses are in rude health and equity prices seem reasonable, especially compared to bonds. If there is a bubble, it’s in the bond market and it’s been inflating for thirty years, which is why we are very wary of long dated fixed interest securities.
The inverted yield curve may or may not presage a recession. That is no reason to lose sleep, provided you are diversified and liquid in the short term, which Courtiers clients are. Sweet dreams!