This year, thanks to Bloomberg, LSE, Barclays and the UK Government, we now have 124 years of data covering returns from UK equities (ordinary shares in quoted British companies), gilts (British government bonds) cash and inflation.
The period includes two World Wars (1914-1918 and 1939-1945), two pandemics (1918 and 2020) and two financial meltdowns (1929 and 2008). It also includes the rise of the automobile and air travel, the discovery of antibiotics, the invention of the computer, the breath-taking global adaptation of information and communications technology (ICT) and a vast array of other developments, too many to mention here, that have revolutionised our world and lifted millions out of poverty.
Table 1 below provides extracts from this year’s study.
Table 1: Summary of data
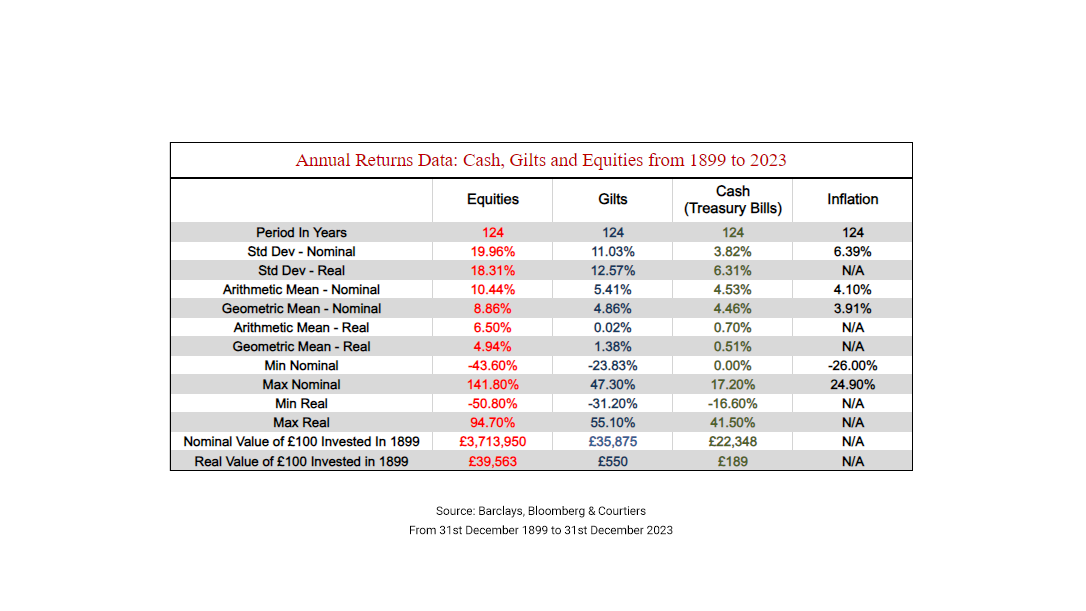
Source: Barclays, Bloomberg and Courtiers, From 31st December 1899 to 31st December 2023
It’s been a golden era for investors. If, in December 1899 you had placed £100 in each of the three asset classes we cover, then by the end of December 2023 the nominal value of your money (with income reinvested) would have risen to £22,348 in cash, £35,875 in gilts and a staggering £3,713,950 in equities (see Table 1). Of course, the whole point of investing is to improve purchasing power, so to get a true comparison of how much investors have really made over the last 124 years, you have to allow for inflation, and that reduces our present pots to their equivalent 1899 purchasing power of £189 for cash, £550 for gilts and a still very healthy £39,563 for equities.
Chart 1: Real (Inflation-Adjusted) purchasing power of £100 invested in December 1899
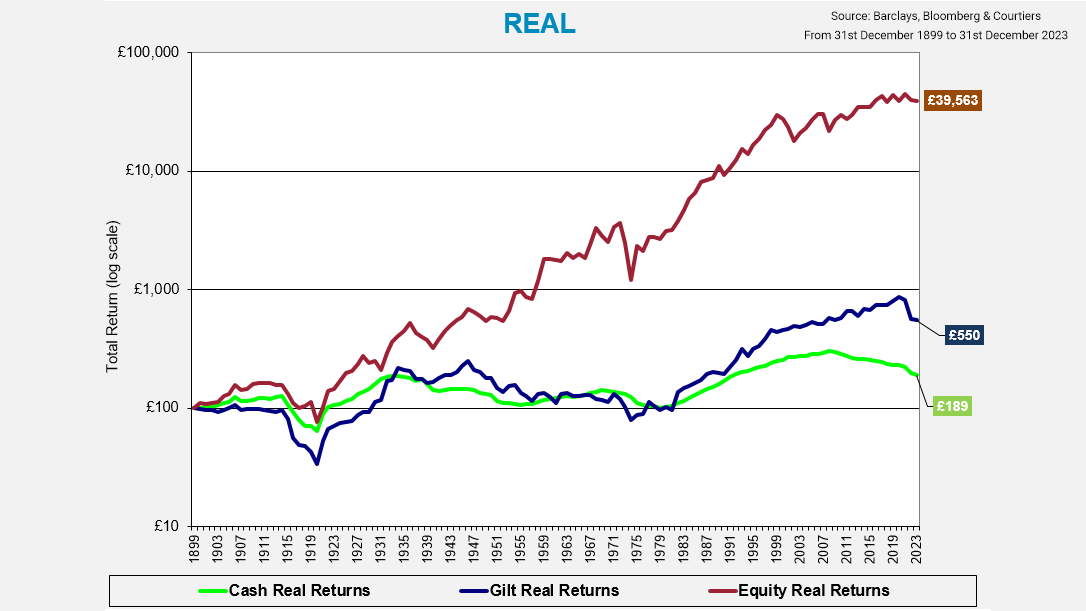
Source: Barclays, Bloomberg and Courtiers, From 31st December 1899 to 31st December 2023
To put these totals into context, the “real” (inflation-adjusted) returns during the last 124 years were 0.51% p/a from cash, 1.38% p/a from gilts and 4.94% p/a from equities.
The recent past
Equities seemed to take the Covid-19 pandemic in their stride and despite returning a negative -9.33% in 2020, quickly bounced back.
Chart 2: Equities total nominal return in year
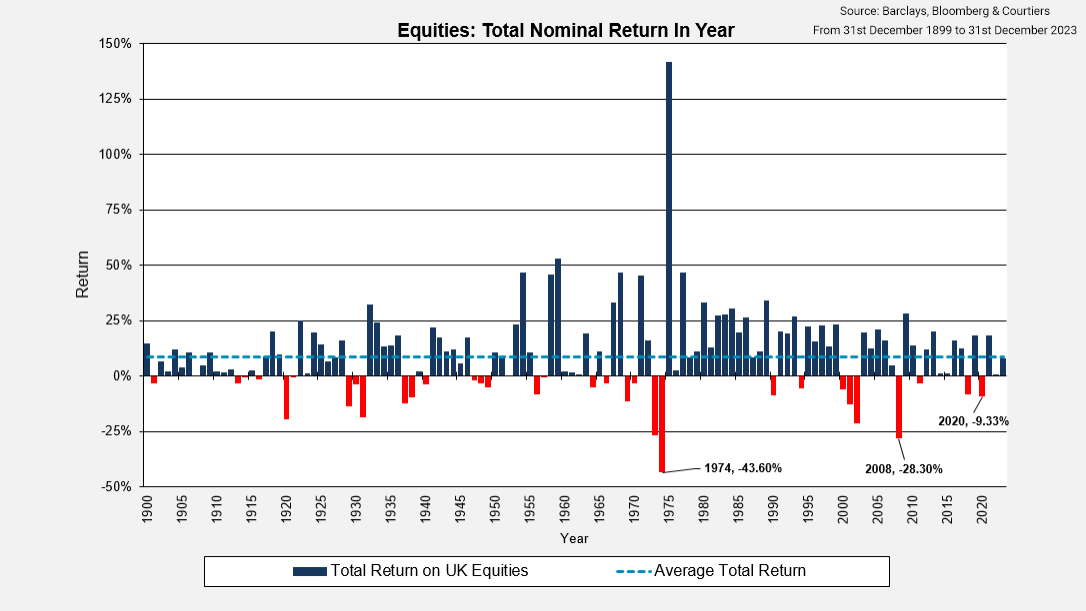
Source: Barclays, Bloomberg and Courtiers, From 31st December 1899 to 31st December 2023
Cash delivered negligible returns through 2020 and 2021 as the Bank of England slashed interest rates and engaged in QE (Quantitative Easing) to support the economy. A move that arguably boosted the UK money supply and savings, and eventually led to high inflation. Gilts did very well in 2020, benefitting from lower interest rates, but collapsed in 2022 as inflation soared and monetary conditions tightened, recording their worst year ever, as highlighted in Chart 3.
Chart 3: Gilts total nominal return in year
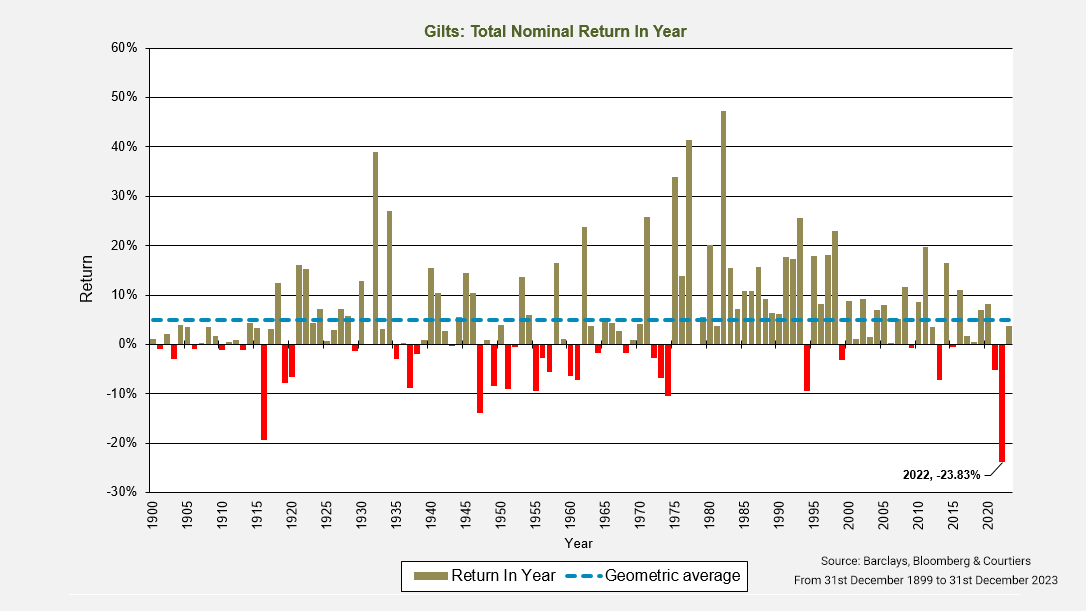
Source: Barclays, Bloomberg and Courtiers, From 31st December 1899 to 31st December 2023
The returns from gilts in our study represent a broad range of maturities. Long-dated (over 15 years) gilts did far worse in 2022 (see Chart 4) losing -54.68% peak to trough. That’s a big fall for a supposedly safe asset!
Chart 4: Index of returns from UK long-dated (over 15 years) gilts
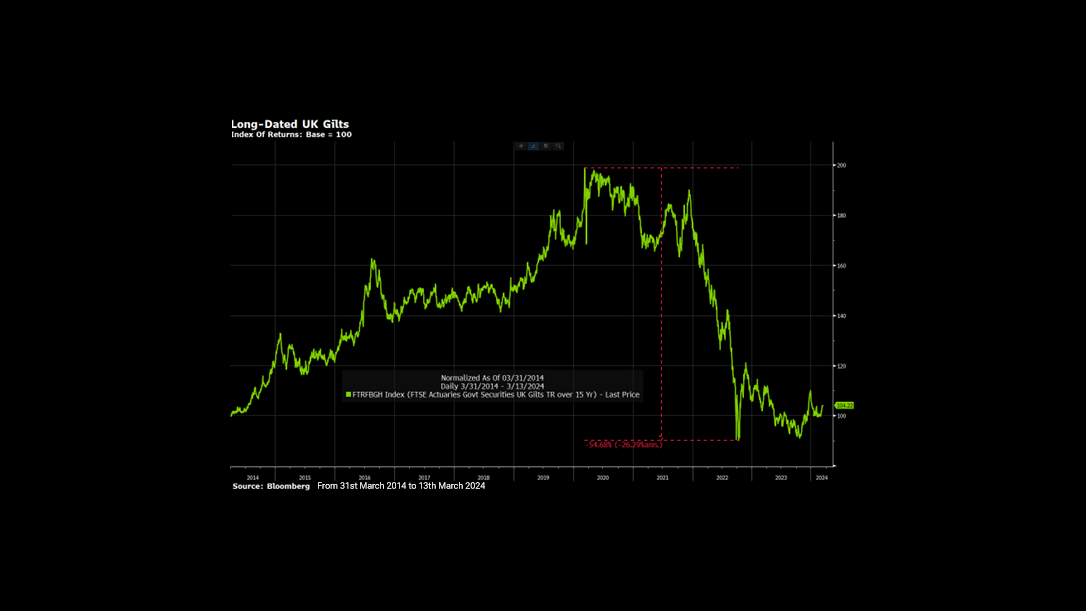
Source: Bloomberg, From 31st March 2014 to 13th March 2024
Risk
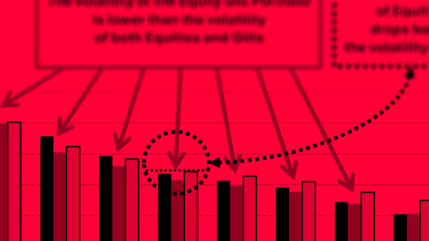
The volatility of annual returns from equities was much higher than from gilts, but the risk from holding equities falls the longer you can keep them and the volatility of returns from equities held for 30 years is considerably lower than for shorter terms (see Chart 5).
Chart 5: Volatility of nominal annual returns over various periods
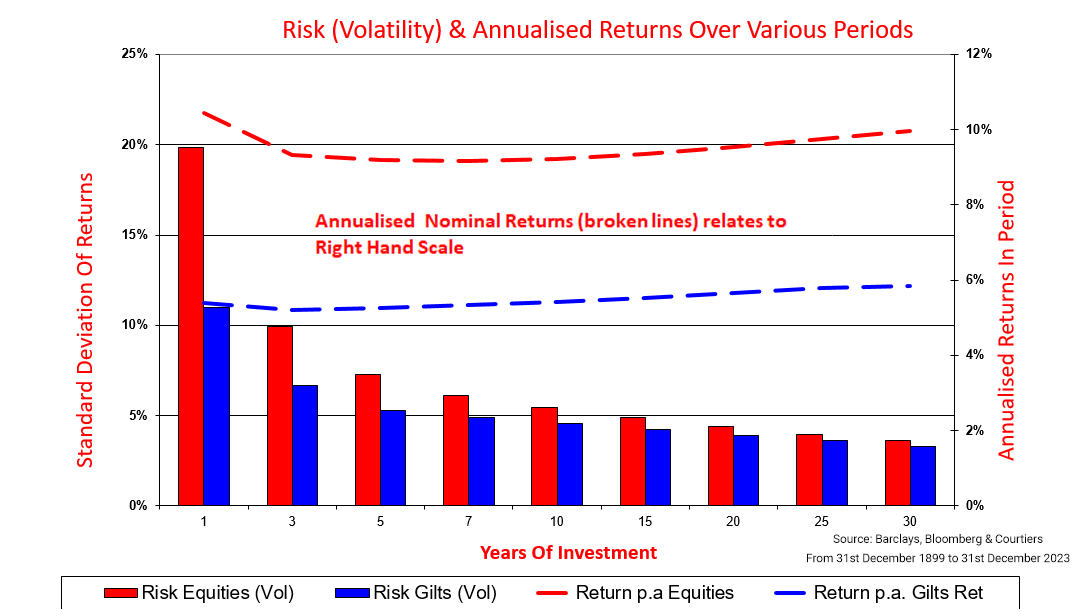
Source: Barclays, Bloomberg and Courtiers, From 31st December 1899 to 31st December 2023
When inflation is taken into account and we look at “real” (inflation-adjusted) returns, the pattern of relative risk is similar for short periods. This changes dramatically for longer periods, as highlighted by Chart 6.
Chart 6: Volatility of real returns from equities, gilts and 50/50 equity/gilt portfolio
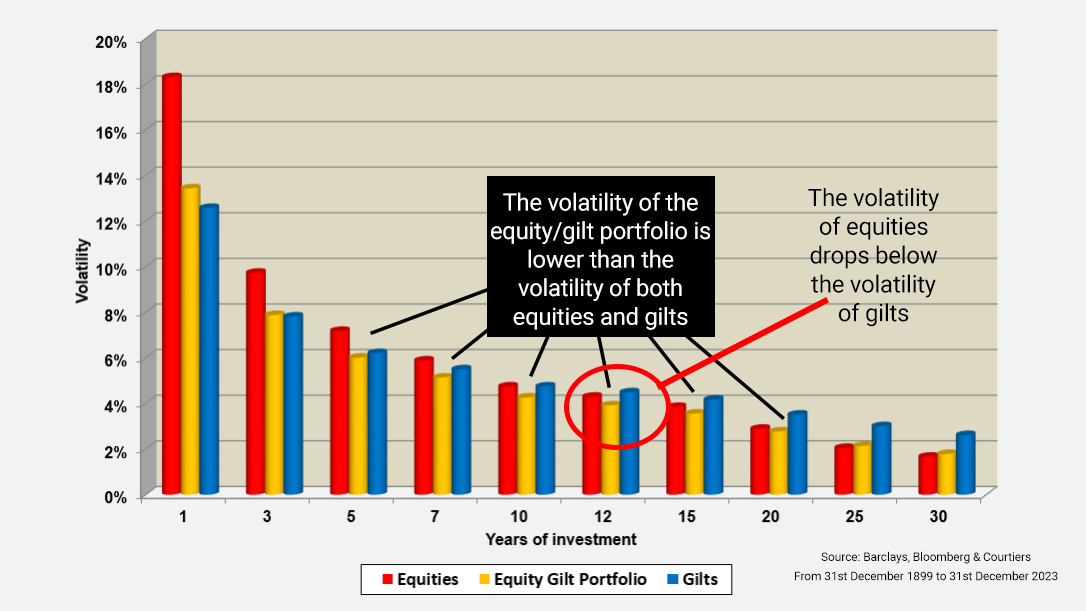
Source: Barclays, Bloomberg and Courtiers, From 31st December 1899 to 31st December 2023
Conventional wisdom suggests that gilts are always safer than equities, but that isn’t true. Once an investor’s time horizon gets to 12 years plus they will enjoy higher average real returns and lower real risk from holding equities, or a combination of gilts and equities. Once the time horizon gets to 25 years, a portfolio comprising only equities delivers higher returns, at lower risk, then either a portfolio of just gilts, or a portfolio of equities and gilts.
We can look further into the relationship between risk and return by considering the Sharpe Ratio, a measure of the return attained by an investor for each 1% of risk (volatility) from their portfolio. Efficient portfolios generate higher Sharpe ratios than inefficient ones. Chart 7 looks at Sharpe ratios for equities, gilts and a portfolio of equities and gilts.
Chart 7: “Real” Sharpe Ratios over various periods
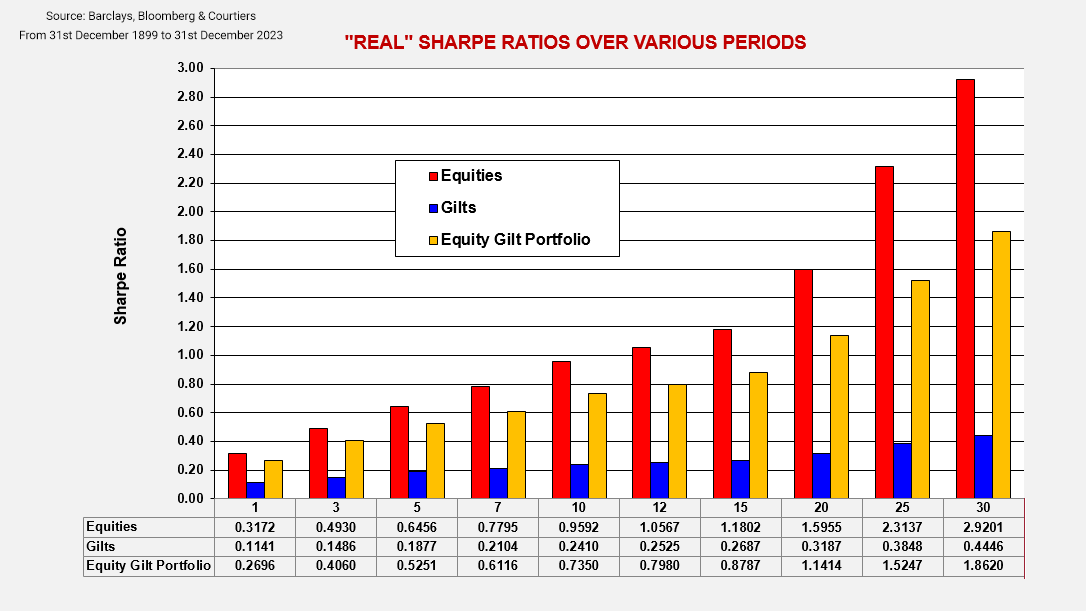
Source: Barclays, Bloomberg and Courtiers, From 31st December 1899 to 31st December 2023
When it comes to real return for your real risk, equities win hands-down over every period and by a country mile over the longer term. That doesn’t mean every investor should stuff all their capital into shares; other considerations, such as objectives, need for liquidity and risk appetite come into play. Can you imagine how an investor would have felt if they had put all their savings for a house deposit into equities at the end of 1973 and then lost nearly half of it the following year? I would suggest pretty sick, and even though markets recovered in 1975, they wouldn’t have known that was coming at the time. It takes a steady nerve to hang on when stock prices are collapsing all around you.
The relationship between equity and gilt returns
Gilt returns tend to be positively correlated with equities, i.e. they move in the same direction, which is intuitive because the value of both represents the present value (PV) of their future cash flows, with both gilts and equities affected by changes to interest rates. The correlation of annual returns over the last 124 years is 0.4646 (or 46.46%). Chart 8 looks at the rolling 10-year correlation which, post the global financial crisis, turned negative and hit a record low of -64.47% in 2012 and remained negative 10 years thereafter. This meant that over the last 15 years, holding gilts was an insurance policy against negative equity returns and that risk reduction premium likely drove gilt prices relentlessly upwards. Normal service resumed in 2023 when the rolling 10-year correlation returned to positive.
Chart 8: Rolling 10 year correlation of returns from equities and gilts
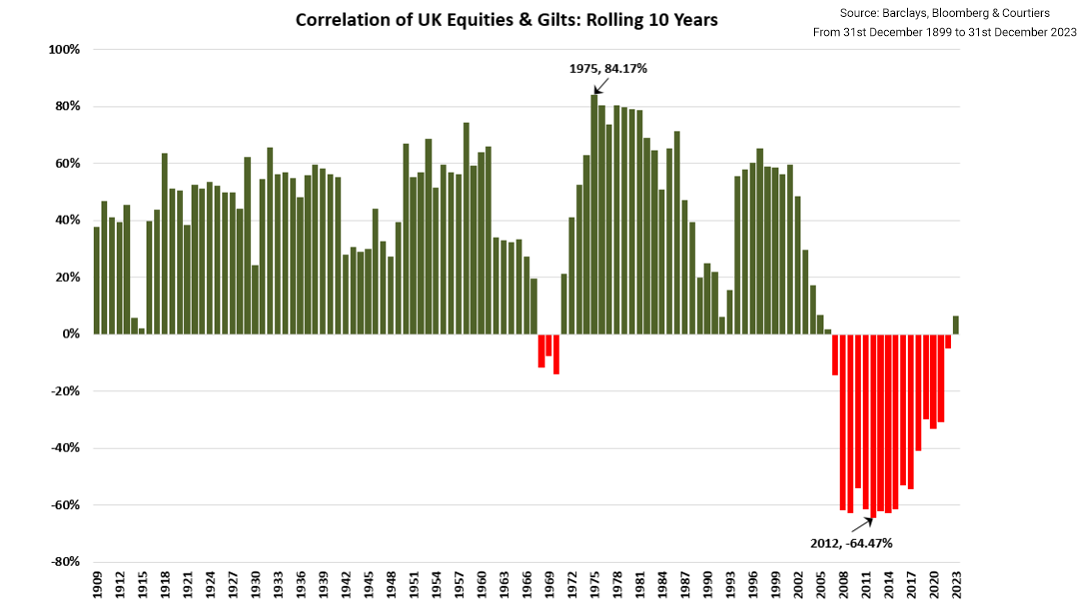
Source: Barclays, Bloomberg and Courtiers, From 31st December 1899 to 31st December 2023
The ‘Magnificent Seven’
Rather unusually I’m going to conclude this year’s comments on our Equity Gilt Study with a reference to America, whose market underwent a rather extraordinary phenomenon in 2023. Whilst many US share prices remained flat last year, the broader index was driven higher by the meteoric rise in the share values of seven large American businesses namely: Amazon, Apple, Google (Alphabet), Meta (Facebook), Microsoft, Tesla and Nvidia.
Chart 9: The Magnificent Seven v FTSE All Share and S&P 500
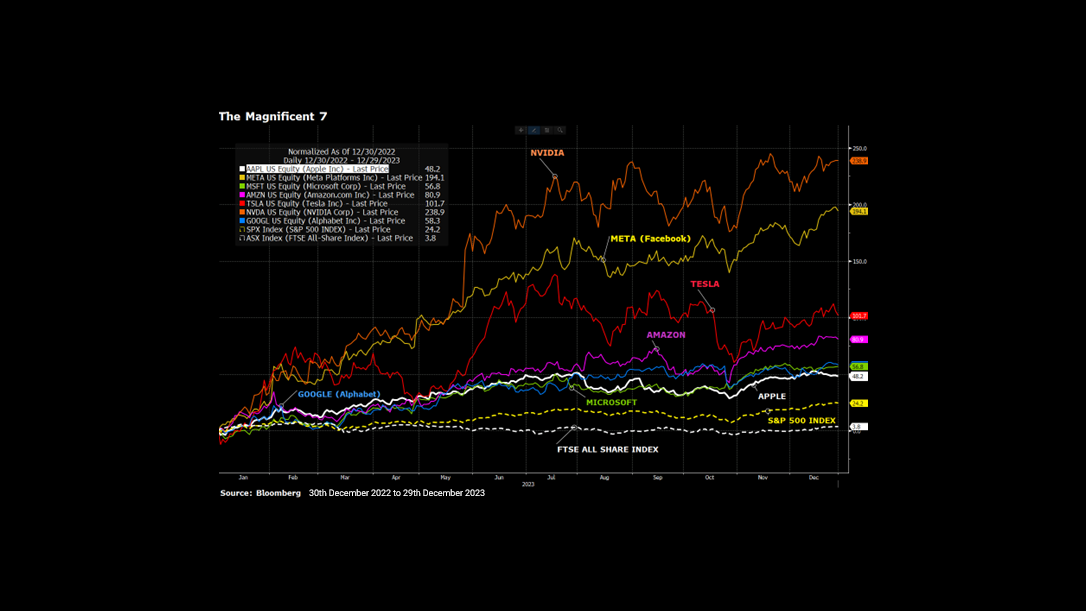
Source: Bloomberg, 30th December 2022 to 29th December 2023. Past performance is not a reliable indicator of future returns. The mention of any stocks or shares should not be taken as a recommendation to deal.
Chart 9 shows how “The Magnificent Seven” eclipsed the performance of the ordinary S&P 500 Index which, were it not for the inclusion of these high performing shares, which now form over 20% of the index value, would have delivered pretty unremarkable returns. The FTSE All-Share Index, also shown in Chart 9, moved upwards by just 3.8%. Very pedestrian when you consider what happened in America. These “Magnificent Seven” stocks trade at earning multiples significantly higher than the rest of the market and excessive compared to historical levels. 2023 felt very similar to 1999 and as we moved through last year a sense of déjà vu overcame me and I could not shake the spectre of the “Tech Wreck” that blighted markets through 2000 and 2001. AI is doing to the market today what the internet did in 1999, with perhaps the difference that the current rally is more concentrated in specific stocks, which has left a lot of other decent companies, with strong earnings and robust balance sheets, looking like the bargain of the century.
Summary
The 124-year period covered by our Equity Gilt Study makes buying shares a non-brainer for the long-term investor. Remember, however, that none of us can adopt a time horizon exceeding a century. We don’t live that long so for us mere mortals 10-years-plus is long enough. The good news is that the 12-year “real” returns from equities, after allowing for inflation, are significantly higher than from bonds, or cash, and at lower volatility. That should be a comfort for the very long-term investor, but do remember that 12 years is also a long time and the interim ride can be very bumpy indeed. Volatility is the price that equity investors pay for superior returns and be under no illusions, that price will be paid, and has been paid, by investors in stocks and shares, on numerous occasions over the past. For those that could stomach the ride, the journey has proved very rewarding.
Let me make one final point. The 124 years of equity returns are from a broadly diversified market portfolio comprising a variety of different businesses. Those that invested in that broad portfolio had some bad years, but they never lost all their capital, not even in the disastrous period of 1973 to 1974. Diversification is the only free-lunch that the market will give you and I recommend investors dine well at its table.