Back in December at our 2018 Client Seminar, a client raised the valid point that, based on the FTSE 100 index, the UK market has seemingly not made any progress since 1999. However, this is based on the price return index, which does not reflect dividend income. The total return index tells another story…
The key difference between the price return index and the total return index is that the latter includes dividends. The impact of this inclusion is particularly evident in the FTSE 100 index, as UK large-cap companies have a tendency to pay large dividends.
Looking at how the FTSE 100 index has performed over the last twenty years, you’d be forgiven for thinking the UK market has barely progressed at all since the turn of the millennium. From a peak of 6,950.6 on 31st December 1999, the index closed at 6,968.85 on 31st January 2019 – a gain of just 0.6%. But for those invested in the UK market, this index doesn’t tell the full story.
As the FTSE 100 index regularly quoted in financial media is the price return index, it does not include the income from dividends paid by the companies within it. If instead we look at the total return index, including dividend income, we see a stark difference in overall performance:

Source: Bloomberg & Courtiers. Total return assumes dividends reinvested. Past performance is not a guide to future returns.
While the classic FTSE 100 index implies an overall return of just +0.6% since 1999, when we incorporate the income from dividends we see that investors have actually earned +96.3%, which equates to 3.6% per year. This is still on the low side given the long-term average total return on UK equities is around 9.1%1. However, since 1999 there have been two major market downturns. If we look at just the last ten years, the annualised total return on the FTSE 100 index is +9.4%.
Source: Bloomberg & Courtiers. Past Performance is not a reliable indicator of future returns.
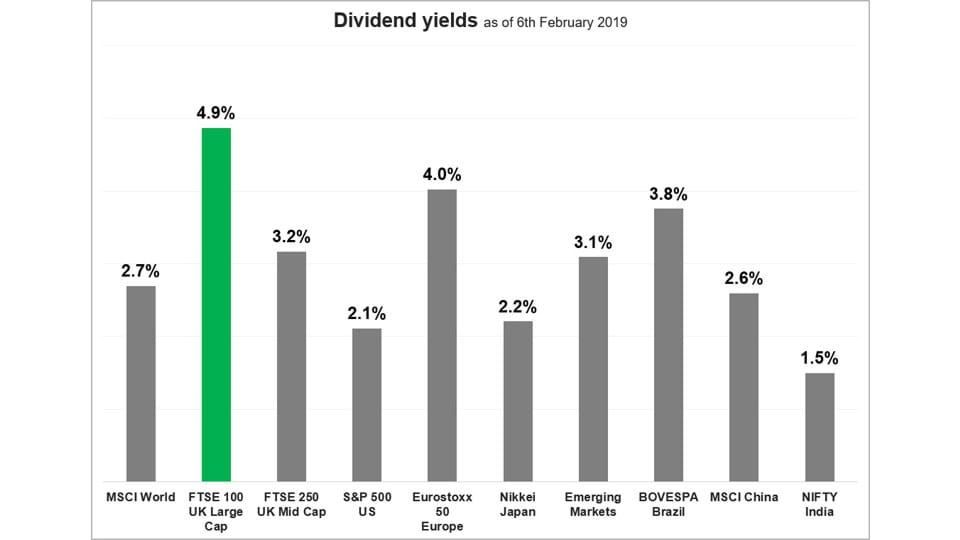
Right now the FTSE 100 index has a dividend yield of 4.9%, higher than all of the other major global equity markets. That means investors in the index are currently receiving an annual return of 4.9% based on dividends alone, in addition to the price return indicated by the FTSE 100 index.
For nearly fifteen years, the peak on New Year’s Eve in 1999 remained the FTSE 100 index’s all time high point, until it was finally surpassed in February 2015. The elusive 7,000 barrier was broken a month later.
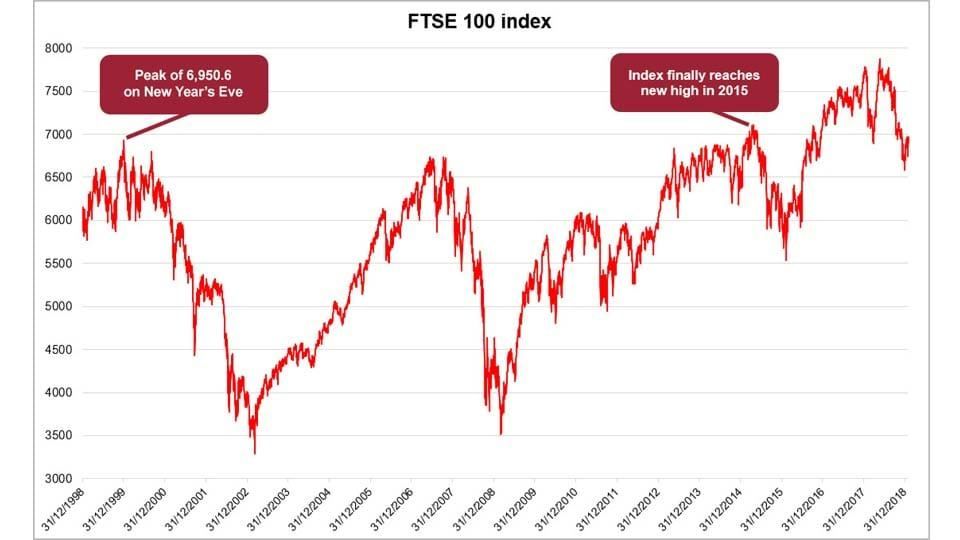
Source: Bloomberg & Courtiers. Returns are price only (i.e. they exclude income from dividends). Past performance is not a guide to future returns.
Whenever looking at the performance of an index over the long term, it is always beneficial to check whether the index is showing you the price return or the total return. As we have seen, it can really pay dividends.
Further reading:
1Courtiers Research Note: Equities vs. Gilts: 118 Years of UK Market Data

