Investors must assume a return on capital to estimate how close they will be to meeting their goals – it’s an essential part of financial planning. This article explains Courtiers’ approach and methods used for forecasting and projecting future returns.
Two key principles apply:-
- Investors are risk averse and in return for taking more risk, they demand higher returns.
- Fundamental metrics are a more accurate predictor of future returns than human intuition.
Both principles are now widely accepted in the world of finance. The first explains why, over the long term, higher risk equities deliver superior returns to lower risk bonds. But how do you predict this superior return that holders of real assets, such as equities, enjoy compared to holders of less risky bonds? One thing we can be sure of is that it’s better to use a methodical approach than to rely on human intuition.
We now have at our disposal a wealth of useful information from the relatively new field of behavioural economics, which was pioneered by Daniel Kahneman and Amos Tversky. Kahneman was eventually awarded the Nobel Prize in Economics in 2002 (Tversky had died in 1996), and a good summary of their work can be found in Kahneman’s book “Thinking Fast and Slow”.
Humans evolved because they are hard-wired to eat, reproduce and survive. Our instincts for each one of these are not necessarily based on logic but are triggered by emotions. Unfortunately for us, these emotions get in the way of making the rational decisions that are essential for long-term investment success. I don’t want to turn this into a thesis on behavioural finance, but I want to give a couple of examples where using a methodical approach trumps one based on intuition.
In the Barclays Equity Gilts Study of 2006, Tim Bond published an article called “Predicting the Equity Risk Premium”. It is quite short (just 10 pages) and is based on a substantial amount of back-testing carried out by Bond and the Barclays’ team. Figure 15 of the article is a chart plotting the relationship between the Price Earnings Ratio (PER) and the subsequent 15-year annualised returns from equities. The R2 (the co-efficient of determination) is a remarkable 0.82, showing that the price that investors pay for each unit of profit (which is what the PER is) explains 82% of the returns investors received in the next 15 years.
A good example of human choice being inferior to a metrics-based approach can be found in the mysterious “value premium” – i.e. the extraordinary tendency for value investors to get better long term returns than growth investors. I covered this subject in two articles on 27th September 2005 and 6th March 2007. In both, I listed reasons why this “value premium” exists and why it is likely to exist in the future. One of those reasons, which as I get older I believe is the biggest driver of the superior return enjoyed by “value investors”, is simply the failure of growth investing to produce even average results.
A “growth investor” tries to pick companies that will grow earnings at a faster rate than the market average. They look for the next Microsoft or Apple. As a result, these investors open themselves up to a range of cognitive dissonances, nicely described by Denis Hilton in his paper, published by the Centre for the Study of Financial Innovation (CSFI) in April 1998, entitled “Psychology and the City” (also referred to as “The Seven Deadly Sins in Financial Decision-Making”). The growth investor is likely to have suffered, to different degrees, from all seven of the deadly sins of financial decision-making but, in particular, confirmation bias, optimism bias and overconfidence, all of which will encourage the growth investor to overpay for stocks which they believe will outperform other stocks and, as the stock market is a zero-sum game, make value stocks cheaper. In other words, value investors outperform simply by avoiding the cognitive biases that are prevalent among growth investors. A metrics-based model helps to eradicate these types of mental shortcomings.
If we are going to use a metrics-based model for forecasting, and if we are using this model for forecasting long-term returns (10 years or more), and if the PER is a powerful predictor of 15 year equity returns, then we should use the PER: that is just common sense.
For as long as I can remember Courtiers has based its forecasts on the Gordon’s Growth Model (GGM) formula which can be summarised as:
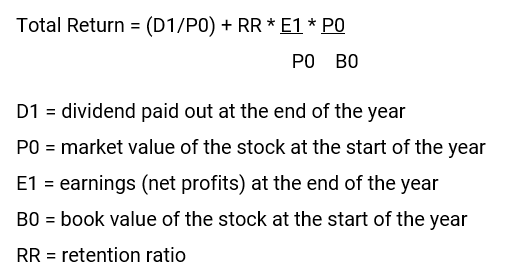
Readers may quickly appreciate that the earnings yield E1/P0 is the inverse of the PER P0/E1. So the PER is an integral part of the GGM equation for forecasting total returns.
This is evident from the following graph which I have constructed to show the inverse relationship between the estimated total return from the GGM and the derived PER.
Chart 1: Forecast Total Return from GGM Including ROE (Return on Equity) and PER at Varying P/B (Price To Book) Ratios
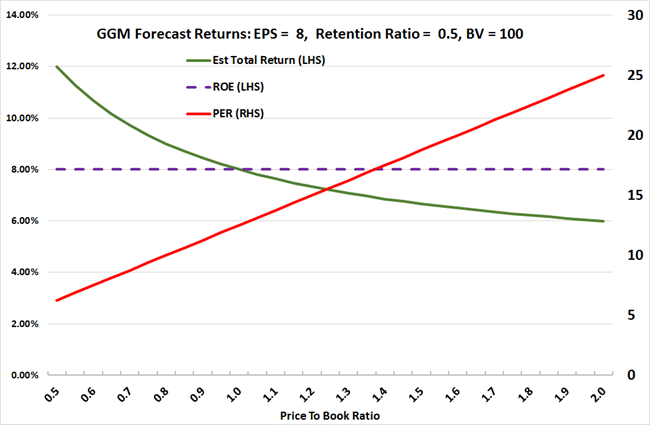
Source: Courtiers
The GGM makes adjustments to total predicted returns by the modification, inherent within the equation, of the dividend yield (D/P). In other words, as the P/B ratio changes the total return is altered by an increase or reduction in the dividend yield. This is highlighted by Chart 2 below.
Chart 2: GGM Forecasts Divided Between Growth and P/B
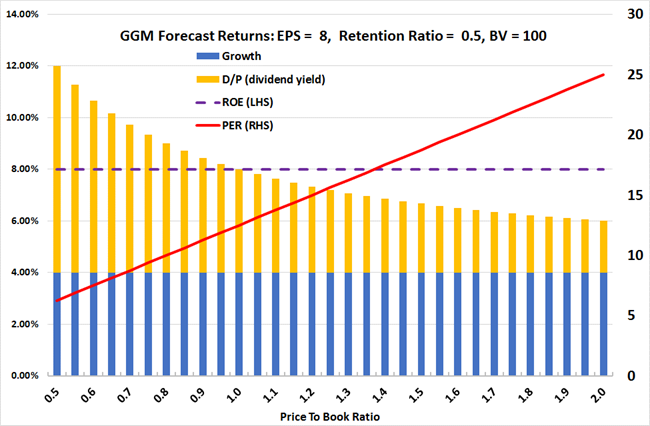
Source: Courtiers
The GGM captures the fact that the price paid for earnings will have a material effect on the investor’s long-term returns. This has been known for some time. In a seminal piece for Fortune magazine, in May 1977, when writing about inflation, Warren Buffett included references to “the investor’s equation” which is, for all practical purposes, the GGM.
The GGM was discussed by McLeavey and Pinto in Chapter 2 of the 2002 version of “Analysis of Equity Investments: Valuation”. Part 4.6 lists the strengths and weaknesses of the GGM as follows:-
Strengths:
- The GGM is often useful for valuing stable-growth, dividend-paying companies.
- It is often useful for valuing broad-based equity indices.
- The model features simplicity and clarity: it is useful for understanding the relationships among value and growth, required rate of return, and pay-out ratio.
- It provides an approach to estimating the expected rate of return given efficient prices (for stable-growth, dividend paying companies).
Weaknesses:
- Calculated values are very sensitive to the assumed growth rate and required rate of return.
- The model is not applicable, in a practical sense, to non-dividend paying stocks.
- The model is also inapplicable to unstable-growth, dividend-paying stocks.
In short, the GGM works best when the asset pays a dividend and long-term growth is predictable and stable, which of course applies when using broad equity indices where the dividend and assumed rate of growth are the averages for all the component parts, and where idiosyncratic risks (ie., the prospects of unsystematic changes to dividends and growth), are removed.
What I like about the GGM is that the forecast returns are adjusted depending on how expensive it is to purchase a unit of earnings. You can see this from Chart 1 above where the forecast return declines as the PER and P/B rise.
One weakness that is pointed out by McLeavey and Pinto is that the GGM is very sensitive to the assumed rate of growth and required rate of return (note, they are talking about using the GGM to determine the true current price of an asset, not the return). I think this is a good point because the value of common equity on a company’s balance sheet may not necessarily represent the true book value, particularly in a stock market that is becoming more dominated by service companies. Intellectual and intangible value may not find its way onto balance sheets, which could, perhaps, explain why the ROE has risen in recent years. It is likely, however, that the ROE is higher because true book values, in missing non-tangible benefits, are lower than they should be. This is not necessarily material to the accuracy of the GGM in making forecasts, but it does perhaps help to explain why the P/B ratio is above average, whilst the PER isn’t.