
We’ve covered the long-term results from UK equities and gilts since 2002. Back then, we reviewed and analysed the data across seven sheets of workbooks with a file size of 202 kilobytes. The 2025 workbook contains 67 sheets in a 1,338 kilobyte file. The rise in available data for all walks of life is simply staggering since the turn of the millennium.
This review marks a milestone, because it now encompasses 125 years of data. I asked Copilot, Microsoft’s conversational AI assistant (its description of itself), if there was any specific symbol representing a 125th anniversary and it suggested gold, signifying longevity, adorned with laurel leaves. That’s an elegant suggestion (thank you Copilot), but I don’t think it’s appropriate to celebrate 125 years of equity returns with a logo representing a competing asset which has drastically underperformed equities in the same period. Gold was priced around £4.25 per ounce in 1899 and closed at the end of last December 2024 at £2,096.33. That represents a return of just 5.08% p.a., way below the return of 8.86% p.a. from UK equities, but better than the returns from gilts (UK government bonds) and cash – see below:
Annual Returns Data Summary: Cash, Gilts and Equities over 125 years (1899 to 2024)
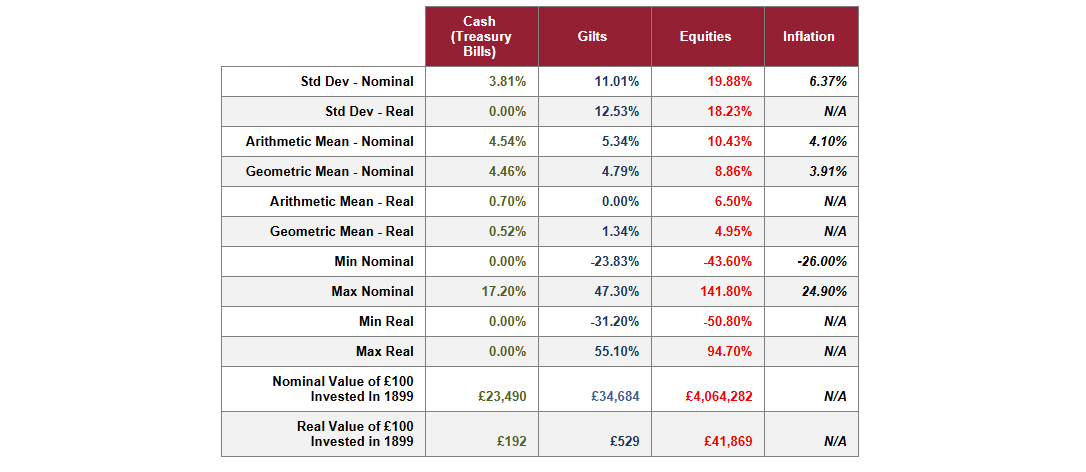
Source: Barclays, Bloomberg & Courtiers
2024 proved a profitable year for owners of equities, which meant that their long-term returns rose compared to 2023. During this period, equities returned 8.86% p.a. while gilts and cash returned 4.79% p.a. and 4.46% p.a. respectively. Adjusted for inflation (which averaged 3.91% p.a. over the last 125 years) Equities returned a very credible 4.95% p.a. while gilts and cash returned 1.34% p.a. and 0.52% p.a. respectively.
To put all of this in perspective, if you’d invested £100 at the end of 1899, by end 2024 it would be worth £34,684 in gilts, £23,490 in cash and a magnificent £4.06 million in equities. Adjusted for inflation, the figures are £344 for gilts, £192 for cash and £41,869 for equities. This means that each of these three major asset classes protected, and grew, purchasing power for their holders over one and 1/4 centuries. That’s not bad considering that the period under review included two world wars (1914-1918 and 1939-1945), two global financial crises (1929 and 2008) and two deadly pandemics (1918 and 2020).
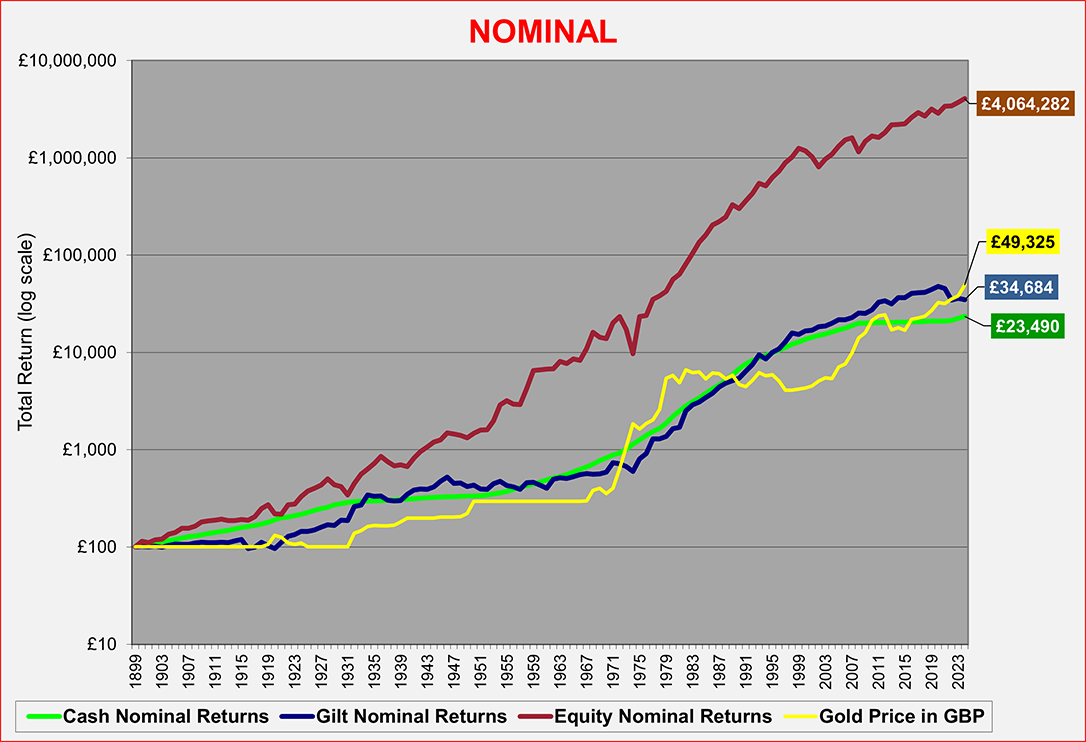
Source: Barclays, Bloomberg & Courtiers
Real Returns
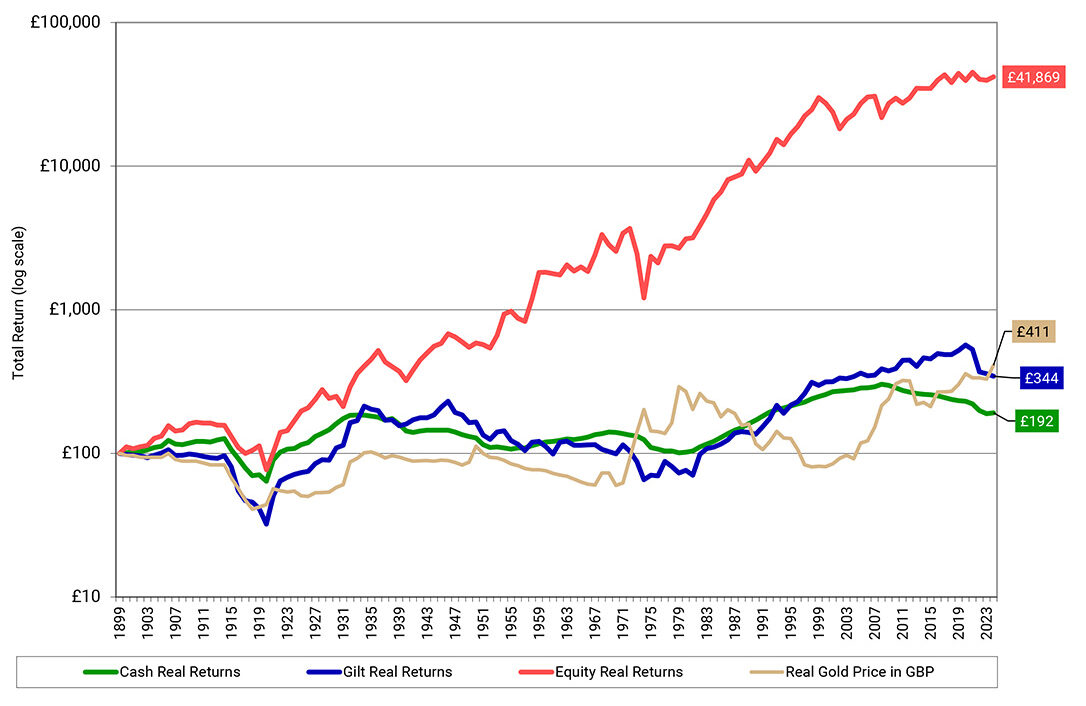
Source: Barclays, Bloomberg & Courtiers
Source: Barclays, Bloomberg & Courtiers
Source: Barclays, Bloomberg & Courtiers
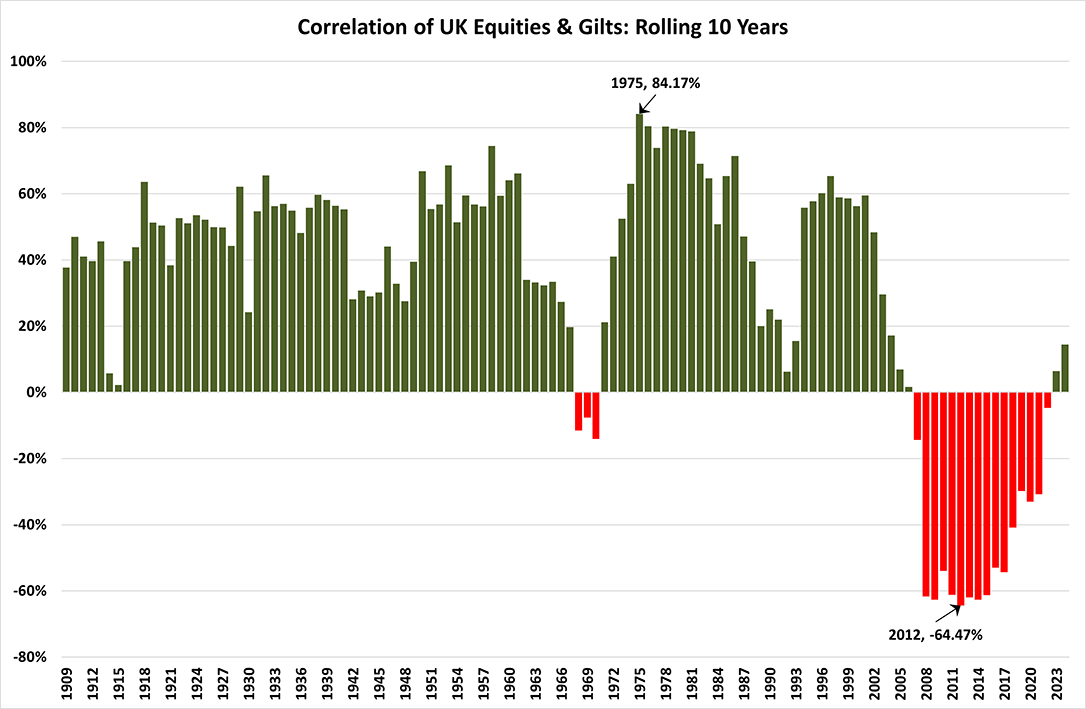
The long term returns from equities and gilts are positively correlated. The chart below shows the rolling 10-year correlation from 1909 onwards. Rather unusually, the 10-year correlation became negative in 2007 and continued to be negative for a further 15 years. The trend ended in 2023 when the correlation between the two asset classes returned to positive territory, and the 10-year correlation between equities and gilts remains positive, and increased, during 2024. The 16-year period of negative correlation represented a time of extraordinary quantitative easing (QE), during which bonds sold at a premium due to their defensive qualities versus equities. Post-pandemic inflation reversed QE and the spectacular decline in bond prices following the Tory budget of September 2022 destroyed the idea that gilts would continue to provide absolute insurance against falling share prices.
Source: Barclays, Bloomberg & Courtiers
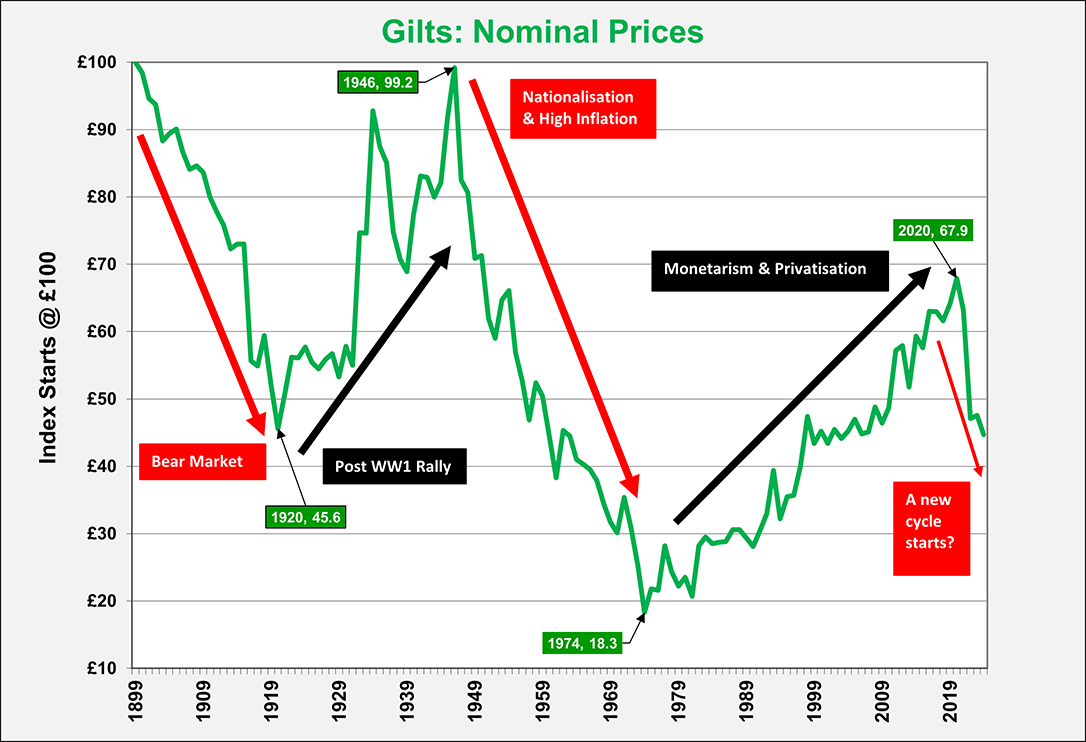
As the relationship between bonds and equities reverted to normality, it is worth asking whether we are at the start of a new cycle. Sidney Homer’s classic work “A History of Interest Rates” plots interest rates and bond prices over nearly 5,000 years. Cycles for bond yields and prices can be long, often spanning decades, but when they change, they change big time. Are we at another seminal point?
The below chart looks at the notional movement in gilt prices since 1899, from which it looks like the direction of travel for bond values changed in 2020 after a 35-year bull run.
Source: Barclays, Bloomberg & Courtiers
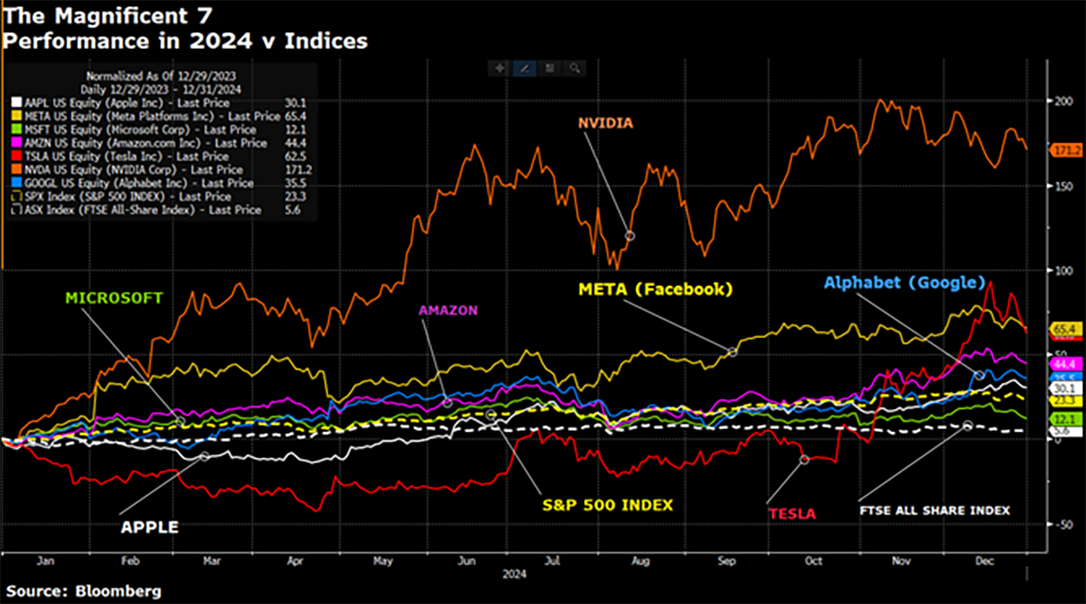
The Magnificent Seven
Last year I mentioned the Magnificent Seven American large cap stocks that in 2023 delivered stellar returns. Well, they did it again (see chart below) and by late December 2024 formed over 30% of the S&P500 Index. Their multiples of earnings-to-market value (the PER – price-earnings-ratio) soared and in December 2024 I said, on my feet at a Courtiers client seminar, that they would underperform this year (see my article The Magnificent Seven – Prospects for the Next Decade). As I write this in March my prediction looks good, but we are a long way from Christmas!
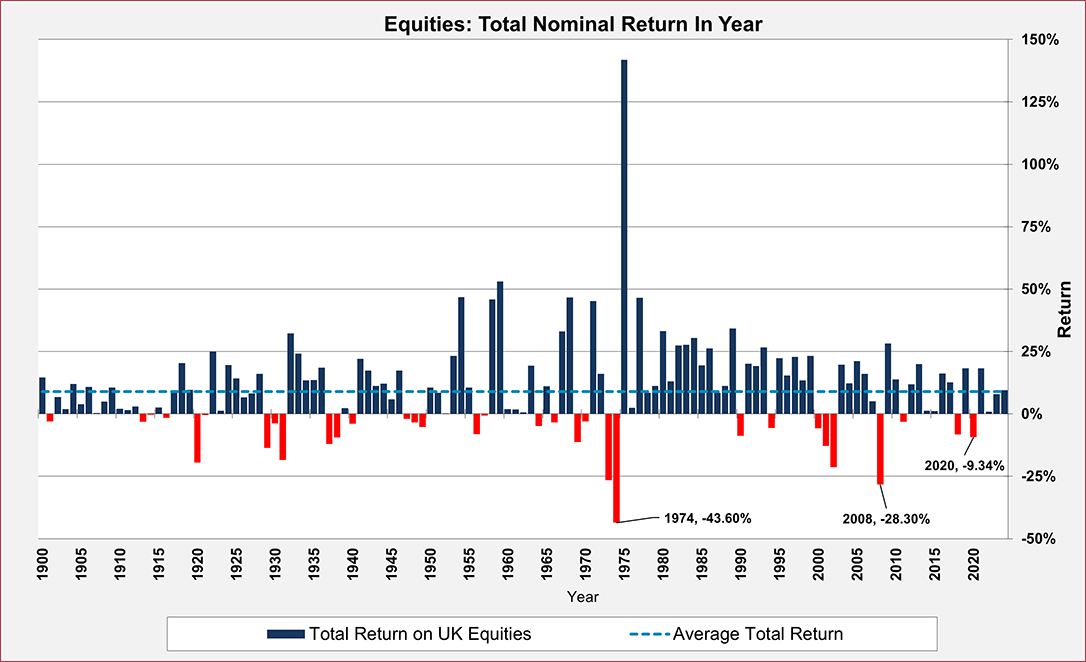
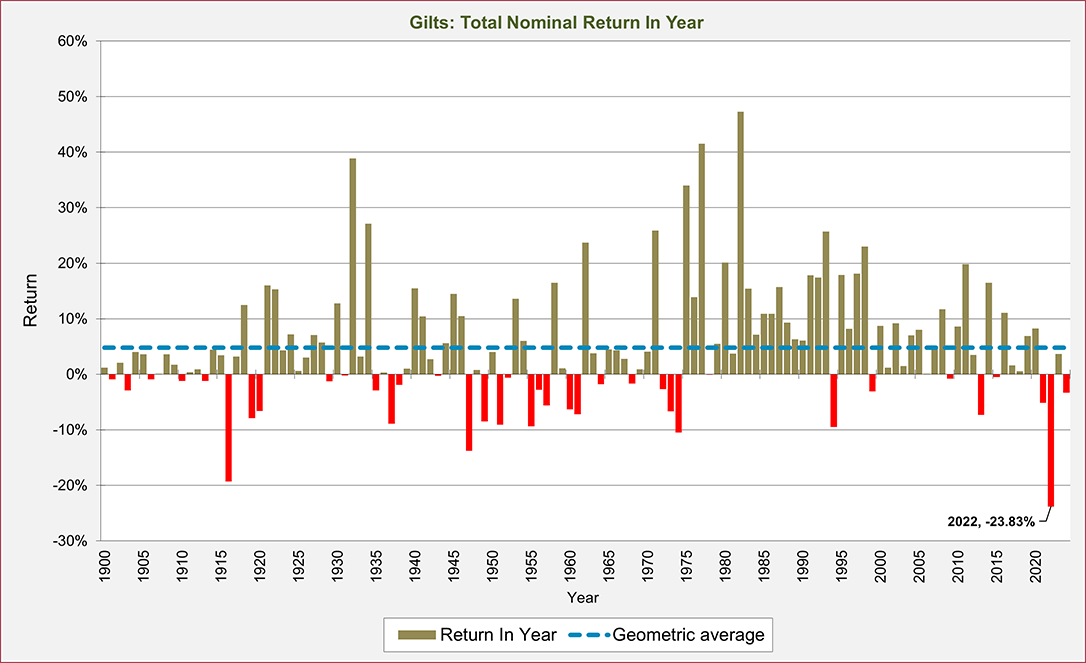
The last 125 years provided rich profits for the equity investor with returns comfortably ahead of inflation. Cash and gilts also delivered positive real returns in the period, but nowhere near the same level. The excess returns from equities come at a price, which is volatility, and short-term movements in share prices can be very painful. For example, in 1974 equity investors lost nearly -45%. So, whilst people like me, who love exploring past returns through historic data, may extol the virtues of equities, if you don’t think you can handle this volatility, then, to take the old phrase, “if can’t take the heat, don’t go into the kitchen!”