Global markets continued to fluctuate during June due to the ongoing uncertainty over where the coronavirus is headed. But despite the wobbles, most equity markets managed to post a third consecutive month of positive returns – continuing the recovery from the huge downturn in February and March – with the MSCI World index climbing another +2.36%.
Volatility remains high, and to illustrate how up and down markets have been this year, consider the following chart which shows how many times the MSCI World index has moved more than 2% in a day:
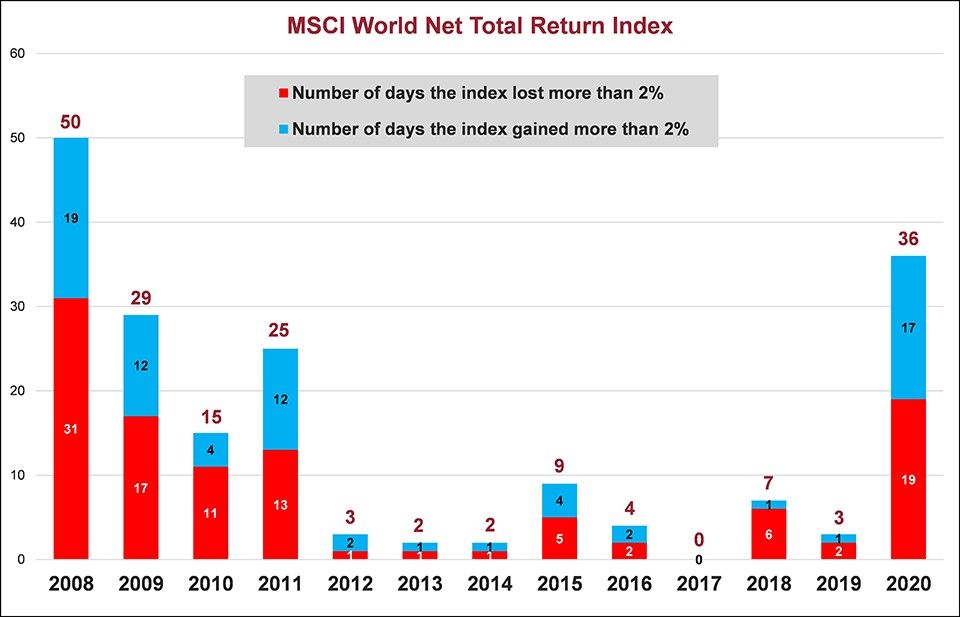
Source: Bloomberg, Courtiers.
There have been 36 days already in 2020 where the index has moved more than 2% either way. This is more than in the last eight years combined, and we’re only in July. Notice in 2017 there wasn’t a single day when the market moved more than 2%, while in 2008 – the year of the global financial crisis – nearly one fifth of trading days saw moves of 2% or greater.
With equity markets remaining volatile, one of the traditional ‘safe haven’ assets – gold – has been appreciating. Since the start of the year the precious metal has gained more than 17% in value, worth $1,786 per ounce at the end of June. This is the highest it has been since 2012.
A full round-up of June market performance
In the UK, the FTSE 100 index gained +1.66%, while medium and smaller companies, measured by the FTSE 250 ex IT index and the FTSE Small Cap ex IT index, moved -0.37% and +3.42% respectively. In the US, the S&P 500 index lifted +1.99%, while in Europe the Eurostoxx 50 index surged +6.49%. Japanese stocks underperformed as the Topix index slipped -0.19%.
Emerging market returns were very positive, with the MSCI Emerging Markets index gaining +6.68%. Latin American equities, measured by the MSCI Latin America index, increased +7.22% and Chinese stocks measured by the MSCI China index soared +8.86%. Indian stocks also performed well as the IISL Nifty 50 PR index rose +7.53%.
In the fixed income market, UK government bonds, measured by the FTSE Gilts All Stocks index, declined
-0.56% and long dated (over 15 years to maturity) gilts fell -1.25%. European corporate bonds, measured by the Markit iBoxx Euro Corporates index, returned +1.32% while sterling denominated corporate bonds, measured by the Markit iBoxx Sterling Corporates index, gathered +1.65%. In the high yield market, the Bank of America Merrill Lynch Euro High Yield index and the Bank of America Merrill Lynch Sterling High Yield index improved +1.87% and +3.05% respectively.
Commodities had a mostly positive month. The S&P GSCI index, which consists of a basket of commodities including oil, metals and agricultural items, rose +5.09%. This was largely driven by the continued recovery in oil, with the price of a crude oil futures contract jumping +12.26%. In the agricultural markets corn and wheat returned +2.95% and -6.15% respectively. The precious metals had mixed fortunes as the S&P GSCI Gold and Silver indices delivered +2.80% and -0.29% respectively.
In the currency markets, it was a mixed month for the pound as it appreciated +0.47% against the US dollar and +0.57% against the yen but lost -0.73% versus the euro.


