
Volatility remained high in June as the continuing rise in inflation and fears of a recession led to a broad sell-off in equity markets. The MSCI World index, which measures global equities, lost nearly 8% during the month, and is now down over 18% for the year to date in local currency terms. This is the most the global equity market has fallen in the first six months of the year since 1970, when it was down 19.3%.
The bearish sentiment seen in markets at the moment is further illustrated in the below chart, which shows the percentage of days each year which have been positive for the equity market versus the percentage of days which have been negative. So far in 2022, just 45.7% of days have been positive, which is lower than in 2008, the year of the global financial crisis.
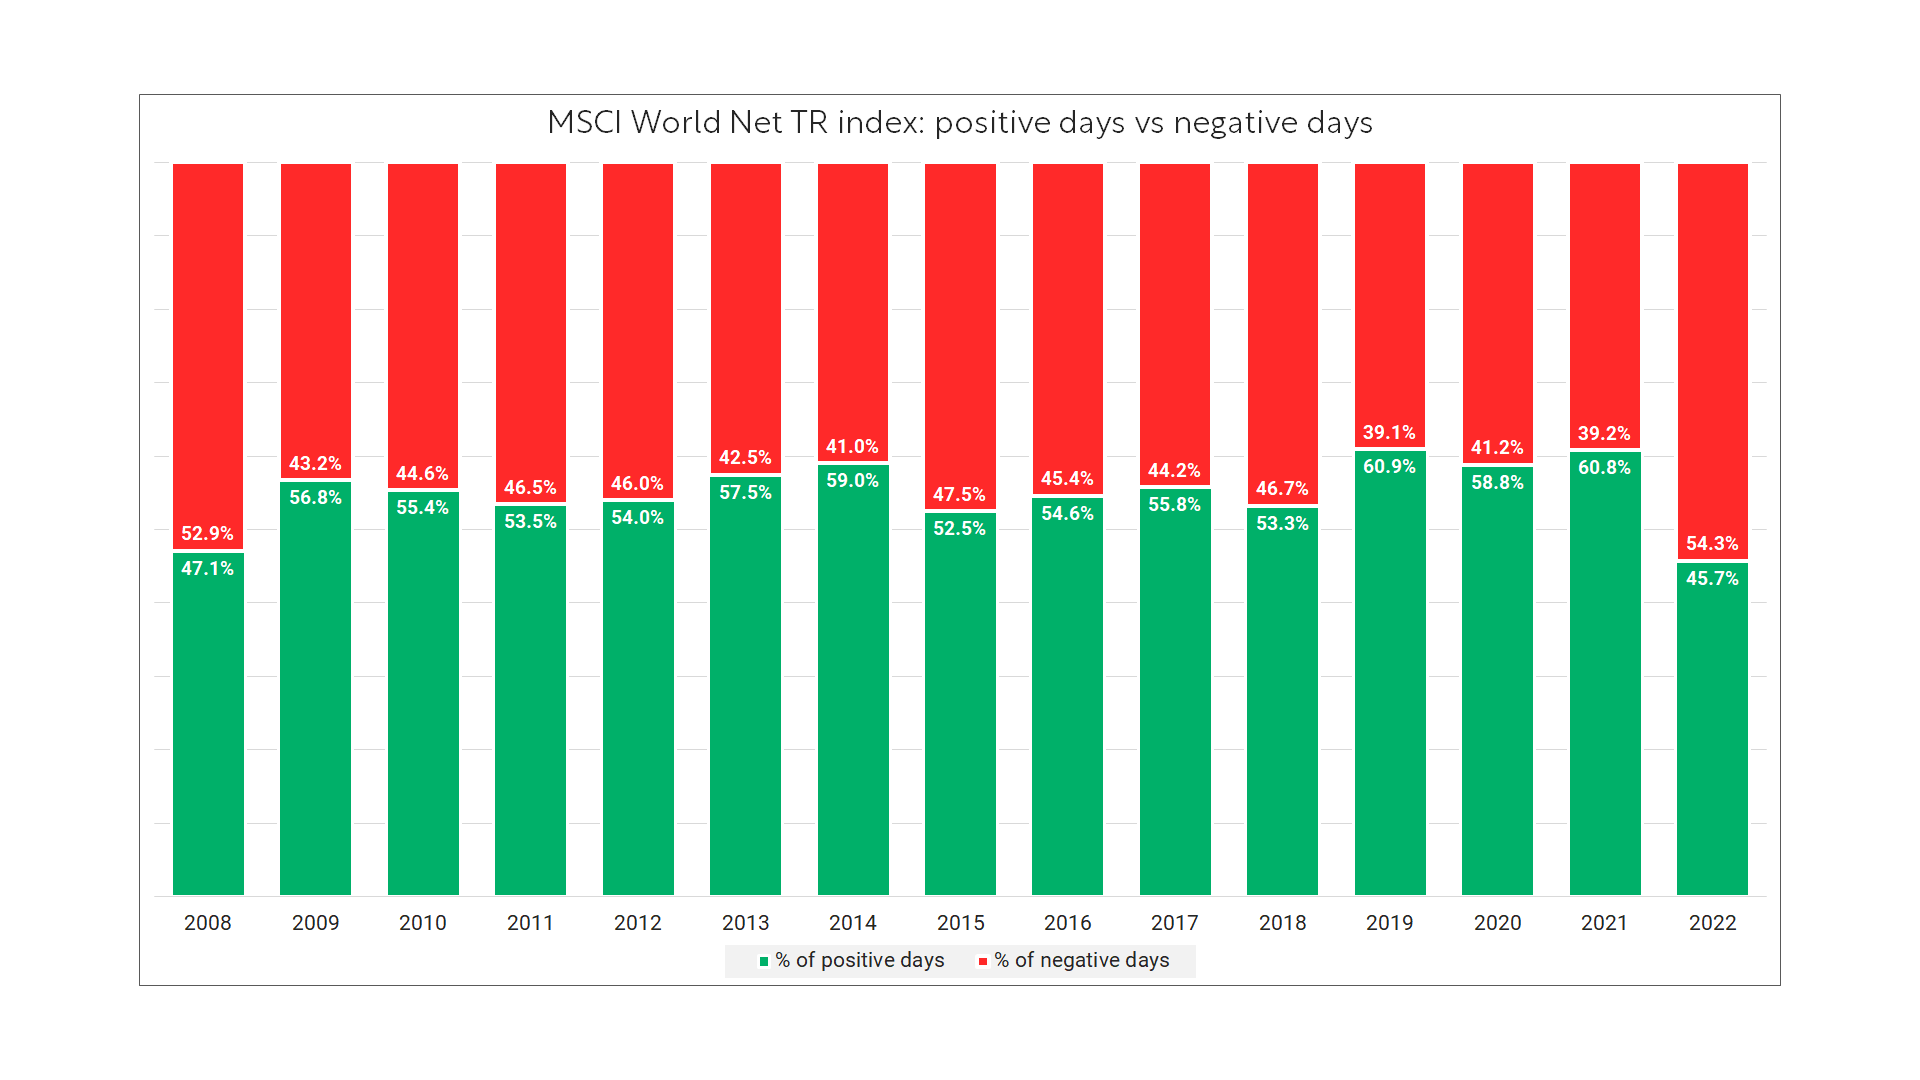
Source: Bloomberg & Courtiers. Daily returns are from the MSCI World Net Total Return index in local currencies. Past performance is not a guide to future returns.
Meanwhile, with central banks increasing interest rates in a bid to combat rising inflation, bond markets have also suffered losses. The Bank of England has just raised rates for the fifth time in seven months, bringing the base rate to 1.25%. The FTSE Gilts All Stocks TR index, which measures UK government bonds, fell a further 1.8% during the month and is now down 14% for the year to date. Longer dated gilts with over 15 years to maturity are down nearly 25%.
Full round-up of June market performance
In the UK, the FTSE 100 index declined 5.53% while medium and smaller companies, measured by the FTSE 250 ex IT index and the FTSE Small Cap ex IT index respectively, dropped 9.62% and 7.98%. In the US, the S&P 500 USD index fell 8.25% while in Europe the Eurostoxx 50 EUR index lost 8.74%. Japanese stocks measured by the Topix JPY index slipped 2.05%.
Emerging markets returns were mostly negative, with the MSCI Emerging Markets index declining 4.47% in local currency terms. Indian stocks measured by the Nifty 50 INR index fell 4.85% while Latin American equities, measured by the MSCI Latin America local currency index, slumped 10.18%. However Chinese equities measured by the MSCI China local index picked up 6.63%.
In the fixed income market, UK government bonds, measured by the FTSE Gilts All Stocks index, lost 1.81%, with long dated (over 15 years to maturity) gilts shedding 3.39%. Sterling denominated corporate bonds, measured by the Markit iBoxx Sterling Corporates index, were down 3.56%. In the high yield market, the Bank of America Merrill Lynch Sterling High Yield index relinquished 5.56%.
There were further negative returns in the commodities market. The S&P GSCI USD index, which consists of a basket of commodities including oil, metals and agricultural items, ended the month down 7.64%. Crude oil futures dropped 7.77% during the month. In the agricultural markets, corn and wheat futures returned -1.29% and -20.11% in USD respectively. In the precious metals markets, the S&P GSCI Gold and Silver indices slid 2.10% and 6.45% in USD respectively.
In the currency markets, it was a mixed month for the pound as it depreciated 3.36% against the dollar and 1.05% versus the euro but climbed 1.94% against the yen.