When the OBR (Office for Budget Responsibility) forecast a -35% decline in UK GDP for the second quarter of 2020, the howls of derision were equally deafening from both the pessimists (who thought the OBR predicted bounce-back was too steep) and the optimists (who thought the OBR had been unduly bleak by expecting the lockdown to continue for three months). The actual paper comprised 23 pages and was full of sensible caveats, which is what one would expect from Government statisticians.
It’s over 50 years since Hong Kong Flu blighted the world in 1968, the last pandemic to strike the UK. Our economy has changed enormously during that time, and even more so since the outbreak of Spanish Flu in 1918, which was one of the biggest killers of the 20th century with estimated global fatalities exceeding 50 million1.
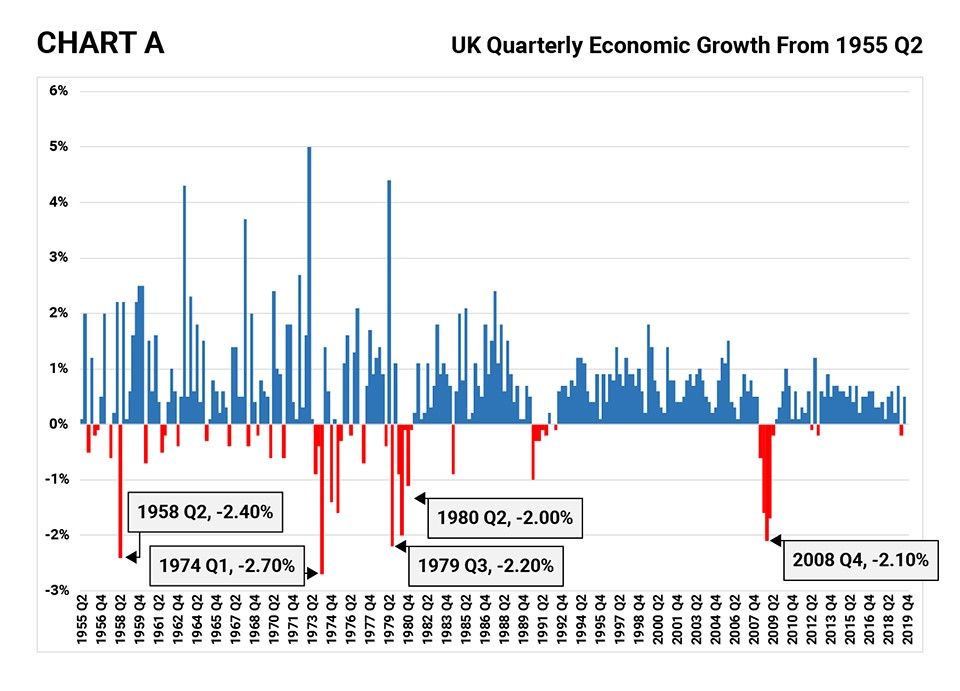
Using data from the ONS (Office for National Statistics) we can track the changes in UK quarterly economic growth back to 1955 (Chart A).
Source: ONS
In the chart I highlight the five bleakest quarters, the worst being a decline in UK GDP of -2.70% in Q1 1974. Interestingly, you will see that there is minimal effect on GDP in 1967/1968, the time of the Hong Kong Flu pandemic. If UK GDP for Q2 2020 comes in at -35% (and I don’t think the OBR will be far off) it will eclipse previous figures by a colossal margin.
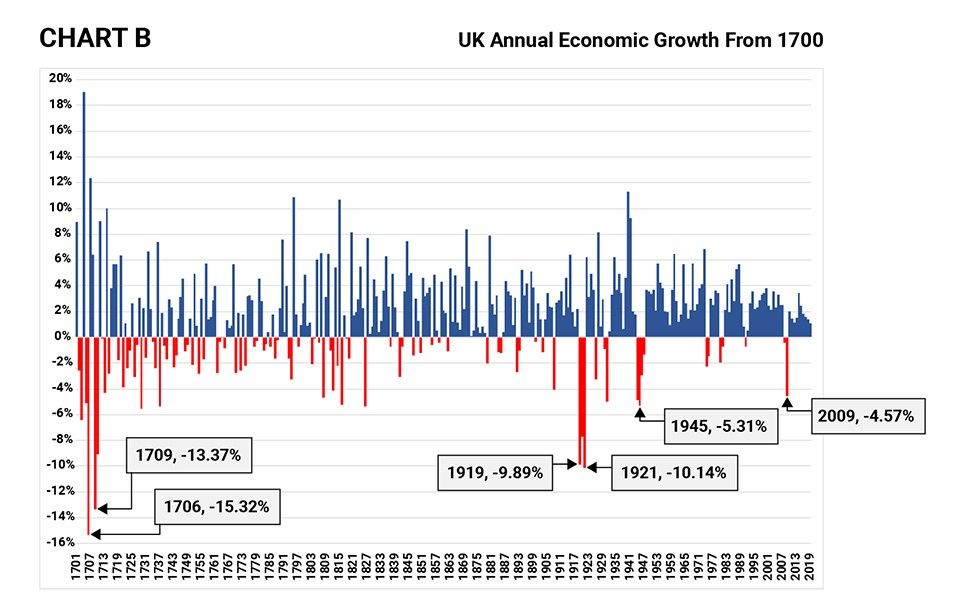
The Bank of England provides annual GDP data from 17012. Using the Bank’s stats and figures from the ONS, I prepared the following chart showing the annual percentage change to UK GDP.
Source: Bank of England and ONS
The worst shock to the UK economy was in 1706 when output declined by -15.32% during the War of Spanish Succession under the reign of Queen Anne. The second worst period of decline was during the Great Frost of 1709 when output declined by -13.37%. Anne’s reign, between 1702 and 1714, was blighted with deep recessions.
Although the OBR expects a -35% decline in GDP in Q2 this year (which incidentally is consistent with INSEE’s3 estimates for the French economy) it predicts a strong rebound thereafter so that the eventual outcome for annual GDP in 2020 is a decline of -12.8%, which would be the worst performance by the UK economy since 1709.
Is the OBR being too optimistic?
In a paper published last month, the Resolution Foundation4 estimated that 80% to 90% of the short-term economic impact of a viral pandemic is not from the virus itself but from the government’s policies, including social distancing, that are designed to control its spread. Put another way, if the OBR is right, then the UK economy may decline by up to -31.5% in Q2 due to social distancing with the remainder (which could be as “little” as -3.5%) being due to Covid-19 itself. It would be reckless of me not to add some further explanation. I am not saying that the UK economy in Q2 will be -31.5% worse off because of government policy. As I pointed out in my article on 9th April 2020, The Economic Consequences of a Lock-Down, a “laissez-faire” (i.e. no government intervention) approach would still have resulted in a huge dent in UK GDP. But there is, in these figures, some comfort because if Q2 GDP declines by -31.5% due to social distancing then it’s logical to assume that the majority of the lost output will come back on stream once the lock-down is eased.
Chart A shows that the economy generally bounces back strongly after a recession. There are occasions when recessions are more persistent, but these tend to be during times of prolonged wars, like the War of Spanish Succession, or World Wars I and II.
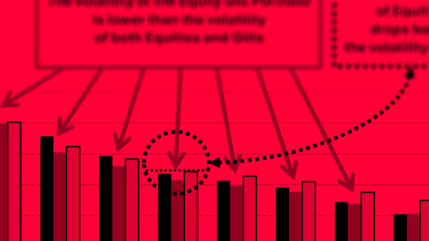
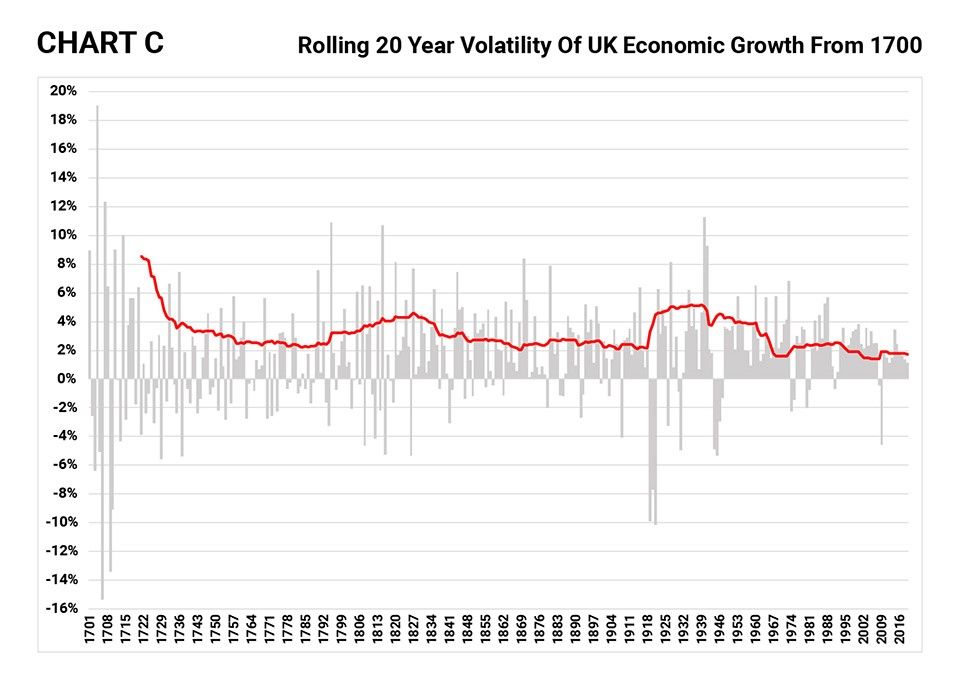
We have learned a lot about how our economy works since Adam Smith, the father of modern economics, published his seminal “Wealth of Nations” in 1776. Recent national output is generally less volatile, as shown by Chart C below. This plots the 20 year standard deviation (volatility) of UK economic growth (the red line) from 1700 to the end of last year.
Source: Bank of England, ONS & Courtiers
In the early 1700s, the standard deviation of Britain’s economic output exceeded 8% per annum – that is massively volatile! But the line declines steadily, with volatility becoming stable during the second phase of the industrial revolution in the Victorian era. It spiked again as a result of World Wars I and II, and declined subsequently, remaining pretty stable for the last 50 years. It is reasonable to assume that the monetary and fiscal tools employed by successive governments have become more efficient at sustaining output and avoiding the destruction of our productive capabilities through wild swings during the normal economic cycles. In other words, we’ve become better at managing ourselves. This being the case, it does not seem to me unreasonable that the statisticians at the OBR would expect a rapid recovery in UK output once social distancing restrictions are eased. History is on their side.
Next week, I’ll look at the relationship, or lack thereof, between GDP growth and asset returns.