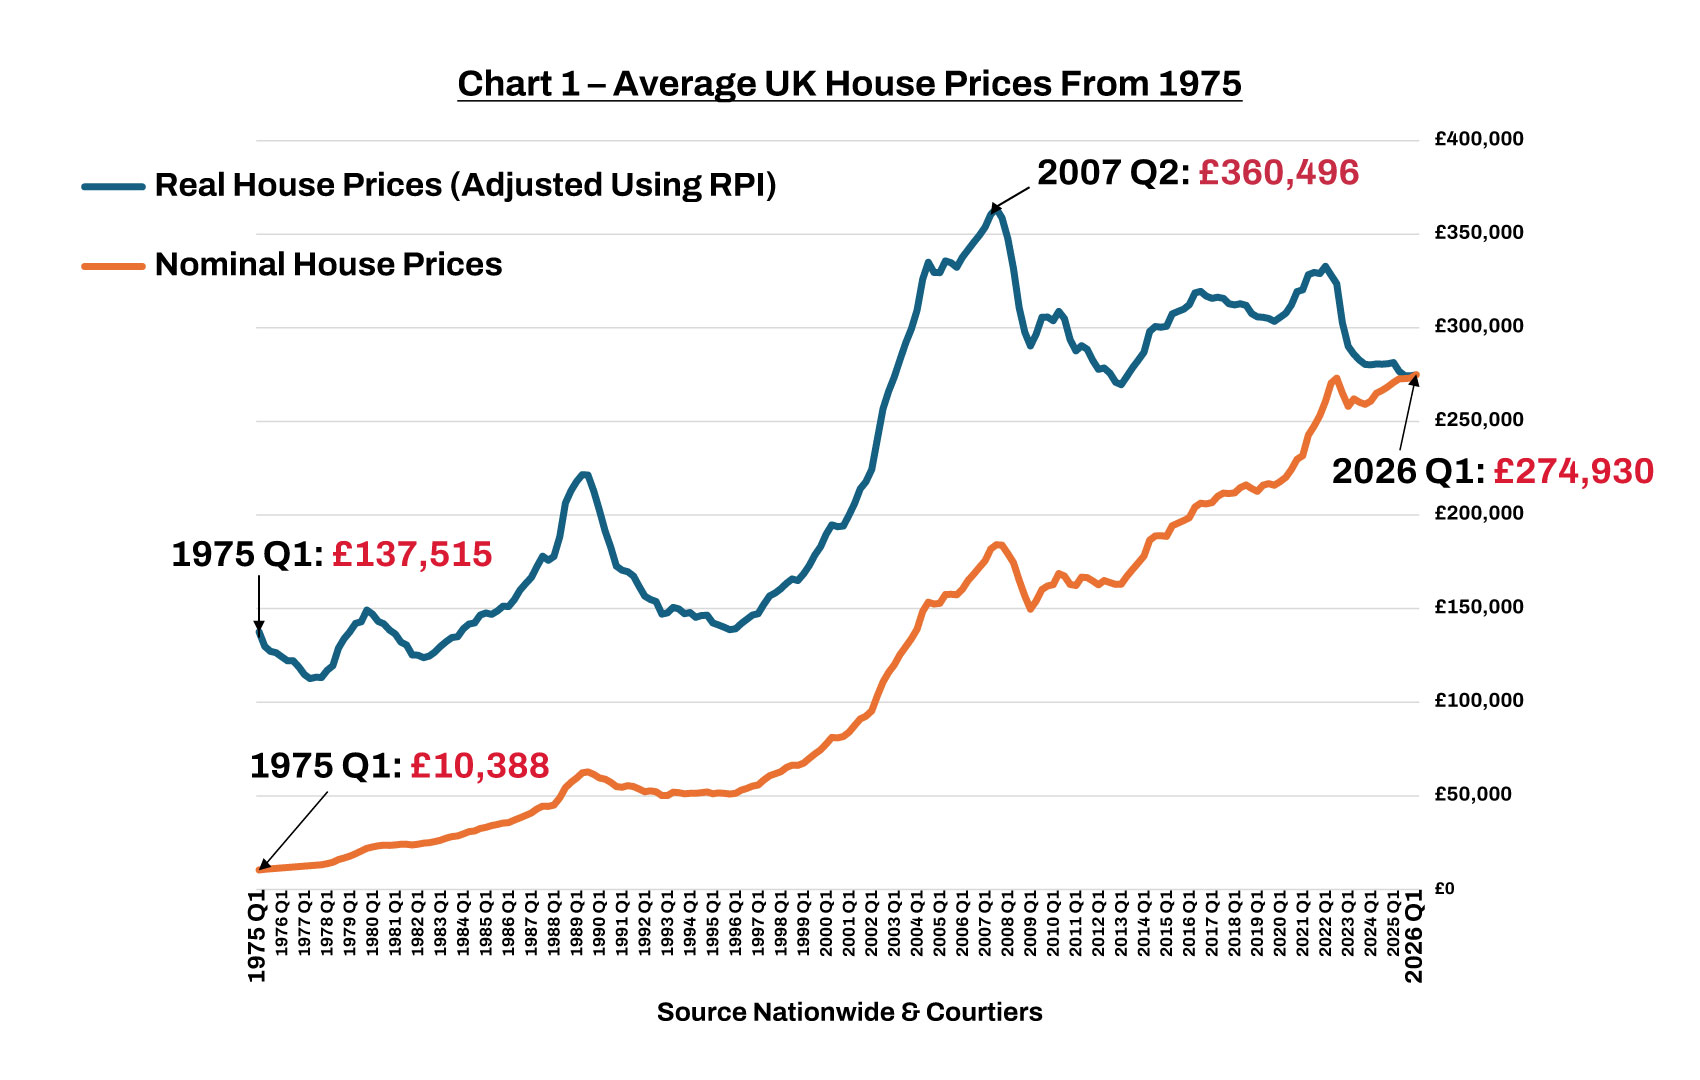
A shortage of decent housing has blighted the UK for years & sent property prices soaring ahead of inflation. According to Nationwide, the average nominal house price rose over 25 fold from £10,311 in 1975 to £274,930 in 2026. After allowing for inflation, our houses now cost twice as much to buy as they did 51 years ago.
There have been various attempts to stem the rapid rise in UK house prices. In 2003, Gordon Brown and John Prescott (then Chancellor and Deputy Prime Minister respectively) commissioned Kate Barker to produce a report on the supply of UK housing. Barker, a leading UK economist and member of the Monetary Policy Committee of the Bank of England between 2001 and 2010, delivered her report in March 2004 along with recommendations for improving the housing supply. To rein-in the real rise in property prices to 1.8% p.a. above inflation (a low bar by anyone’s standards), Barker recommended increasing the annual number of new builds to 210,000 – a rise of 70,000 p.a. To get price rises down to 1% p.a. above inflation, she recommended building 250,000 new homes annually.
I published research notes covering the inadequate supply of housing in Britain on 9th October 2006 and 23rd October 2007, specifically referencing Barker’s targets for newbuilds. At the time, it looked like these targets would be missed, but the data now shows that Blair’s New Labour government of the early/mid noughties did OK, as highlighted by Chart 2.
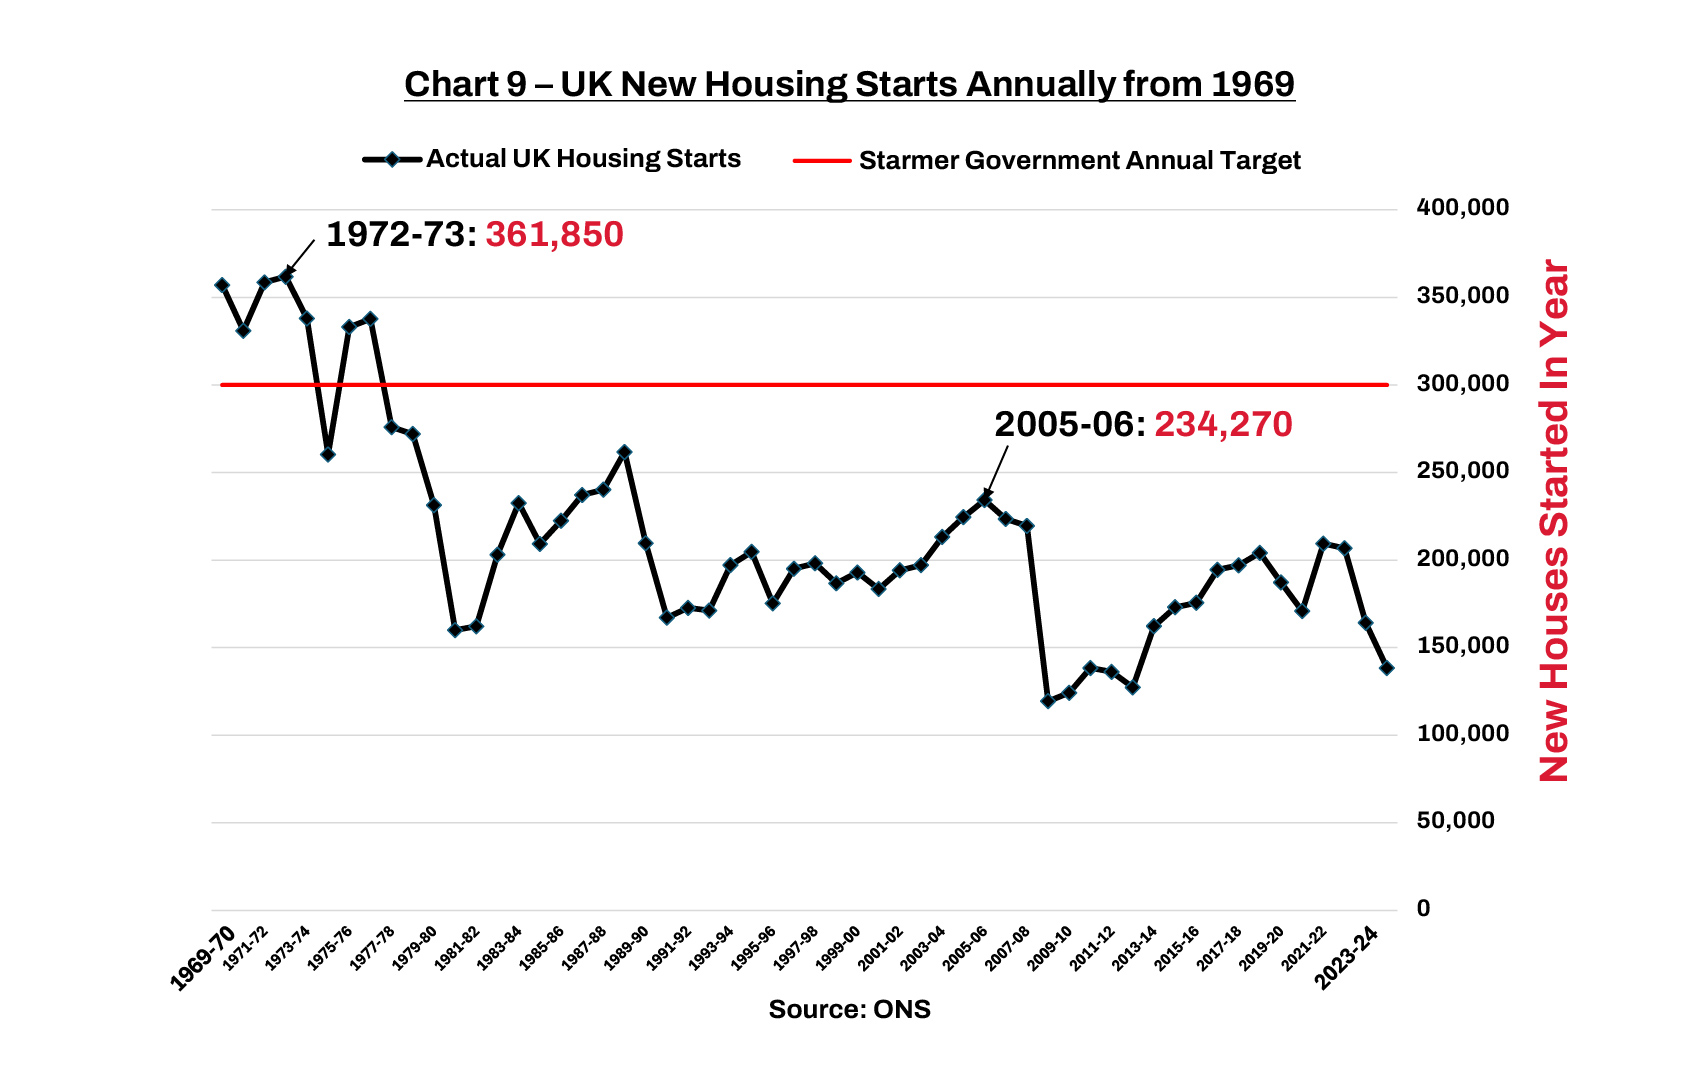
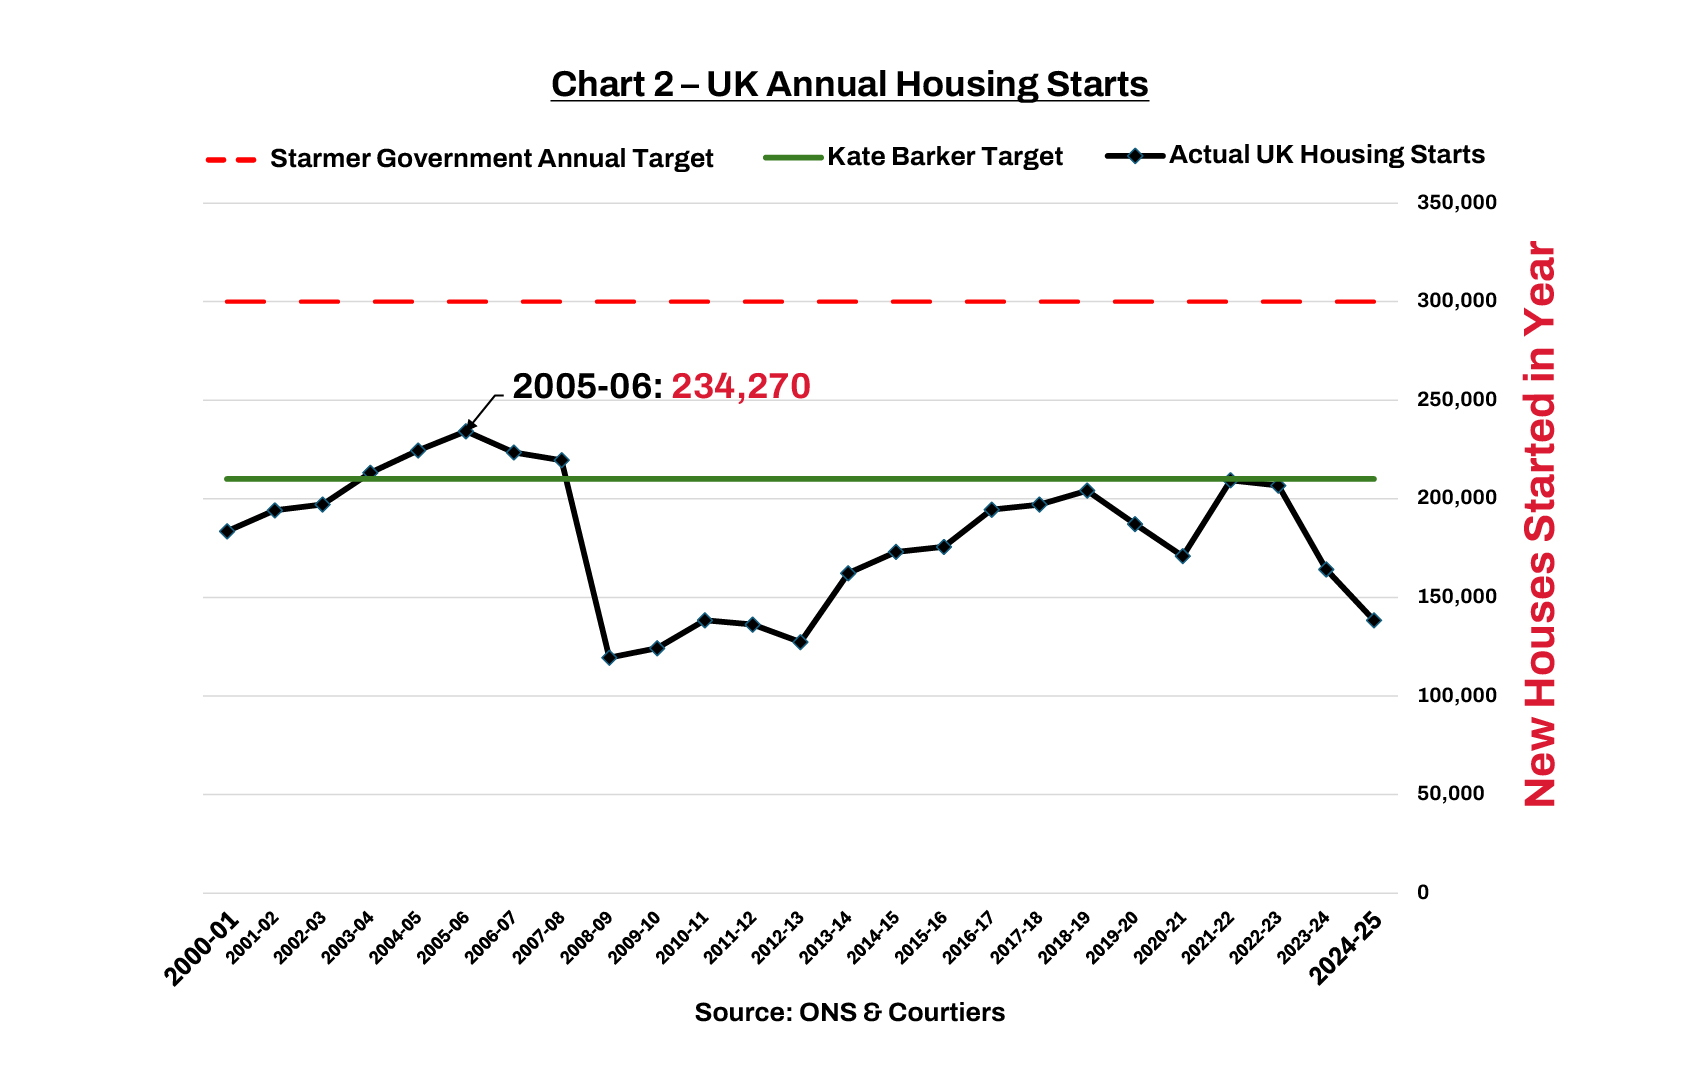 Housebuilding under New Labour increased through the early years of this century, peaking at 234,270 in 2005/2006 before dropping precipitously after the 2007/2008 GFC (Global Financial Crisis) and remaining depressed for years thereafter. This fall in new builds perpetuated the UK’s housing shortage and as interest rates were slashed post GFC, and QE made cheap long-term money available, asset prices rose making housing even less affordable for those yet to get on the property ladder. You can see these effects by the rise in the House Price/Earnings Ratio (the Median House Price/Median Earnings) as highlighted in Chart 3 below.
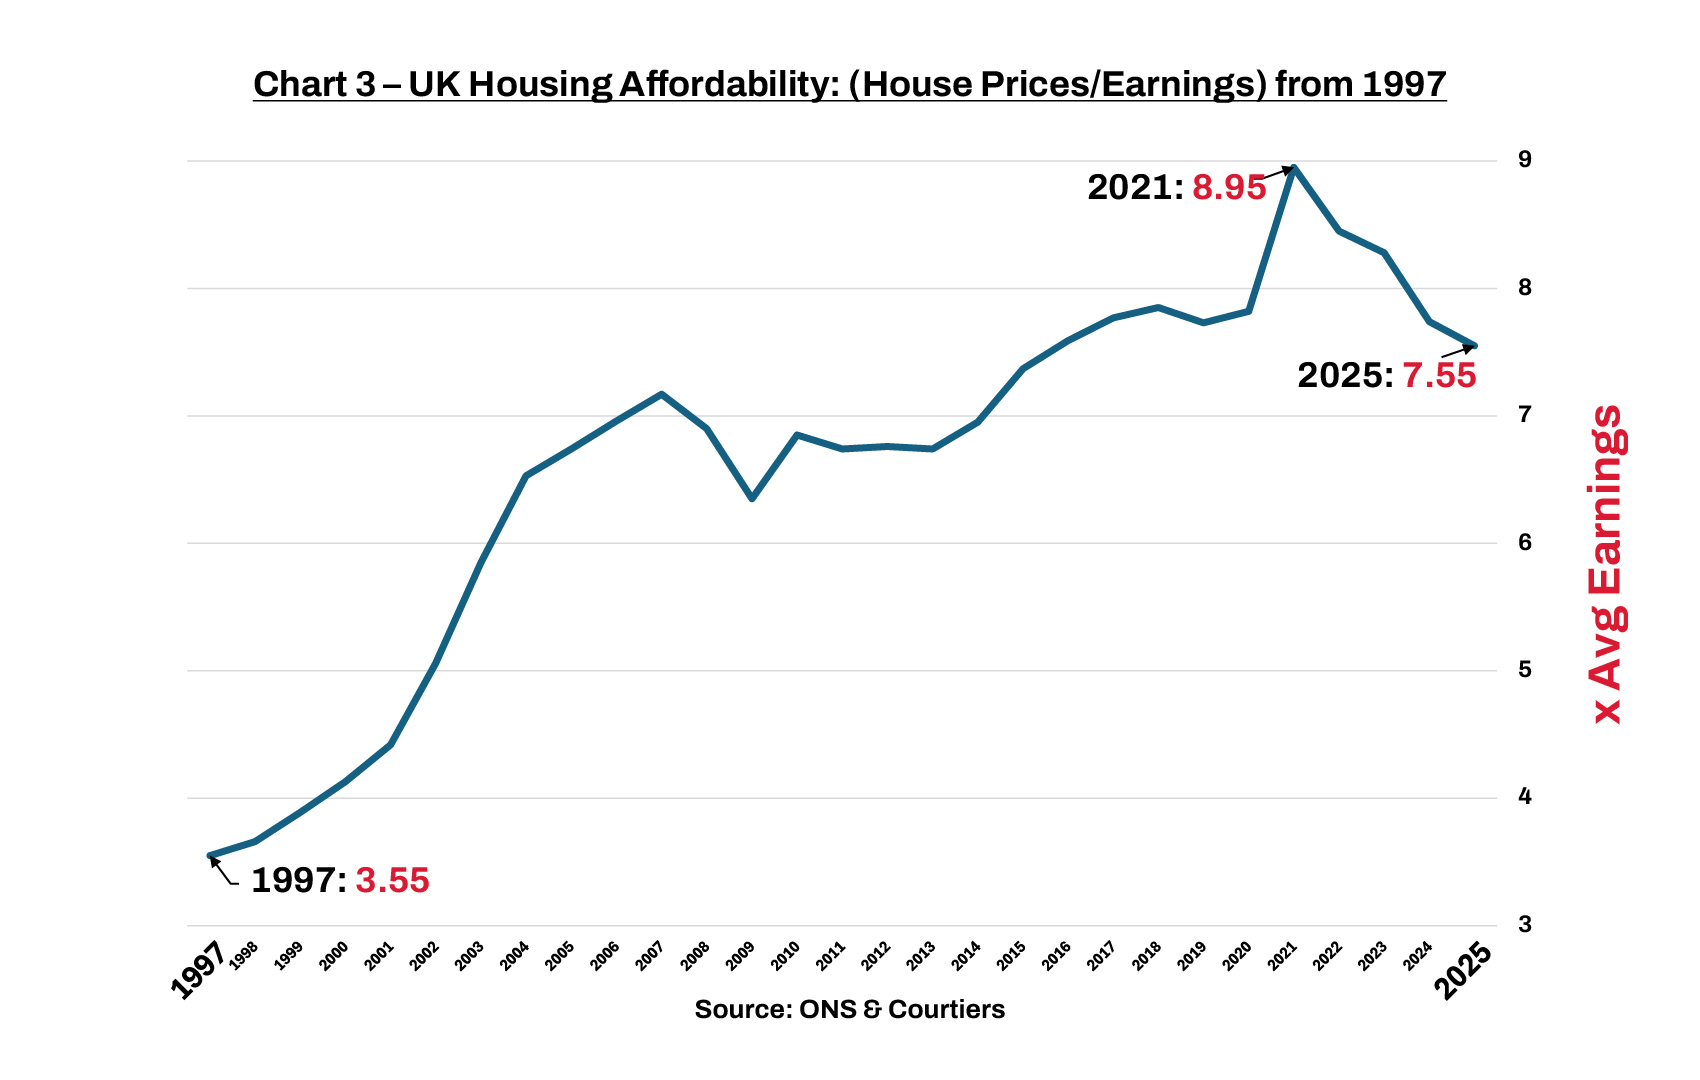
In 1997 the average house price was 3.55 times average earnings. By 2021 the multiple had risen to 8.95 times average earnings.
A bigger and bolder housing target
After coming to power in July 2024, Starmer’s Labour government announced it would build 1.5 million new homes in this parliament. That is an ambitious advance on previous goals. Unfortunately, the programme hasn’t got off the ground (or perhaps it’s more accurate to say it hasn’t got spades in the ground) as highlighted by Chart 4 below.
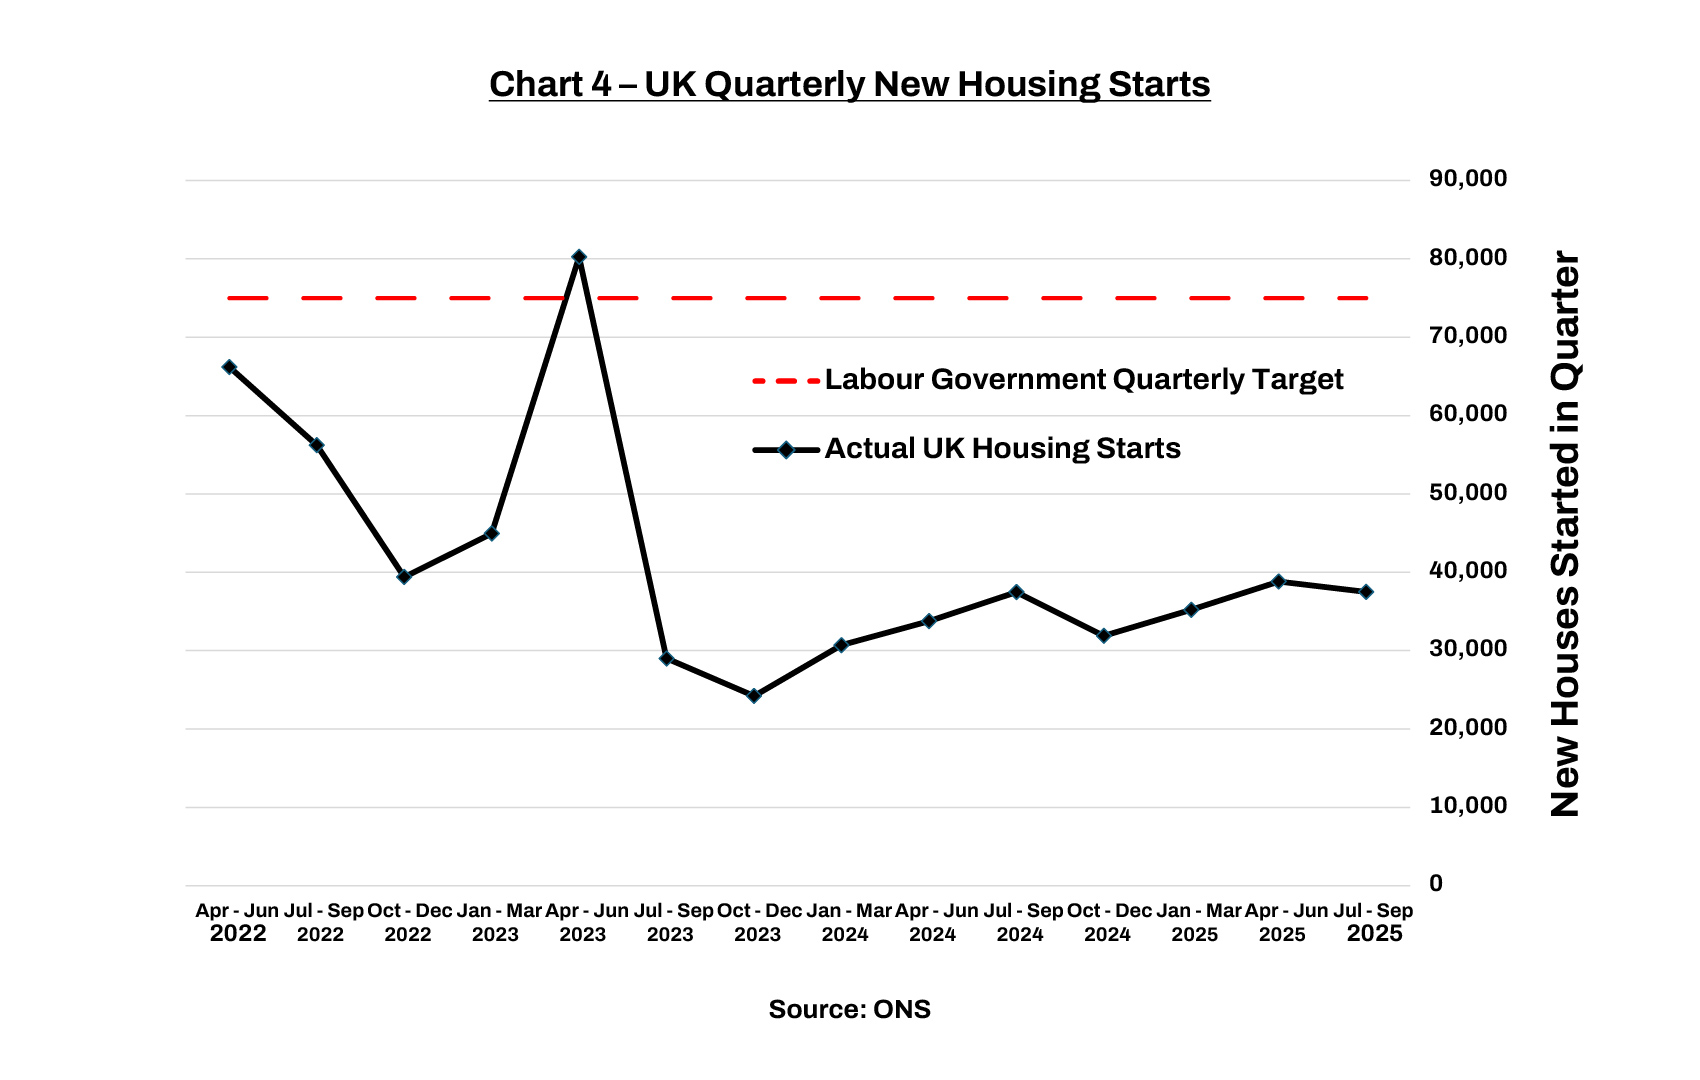
New starts in Q3 of 2025 were exactly 50% of the total needed to achieve the Government’s lofty target.
Demographics Are the Key Driver of Demand for Housing
People need somewhere to live, ergo, if your population increases you need more houses.
The number of family units in the UK has increased steadily and Chart 5 plots their growth from 1997 to 2025.
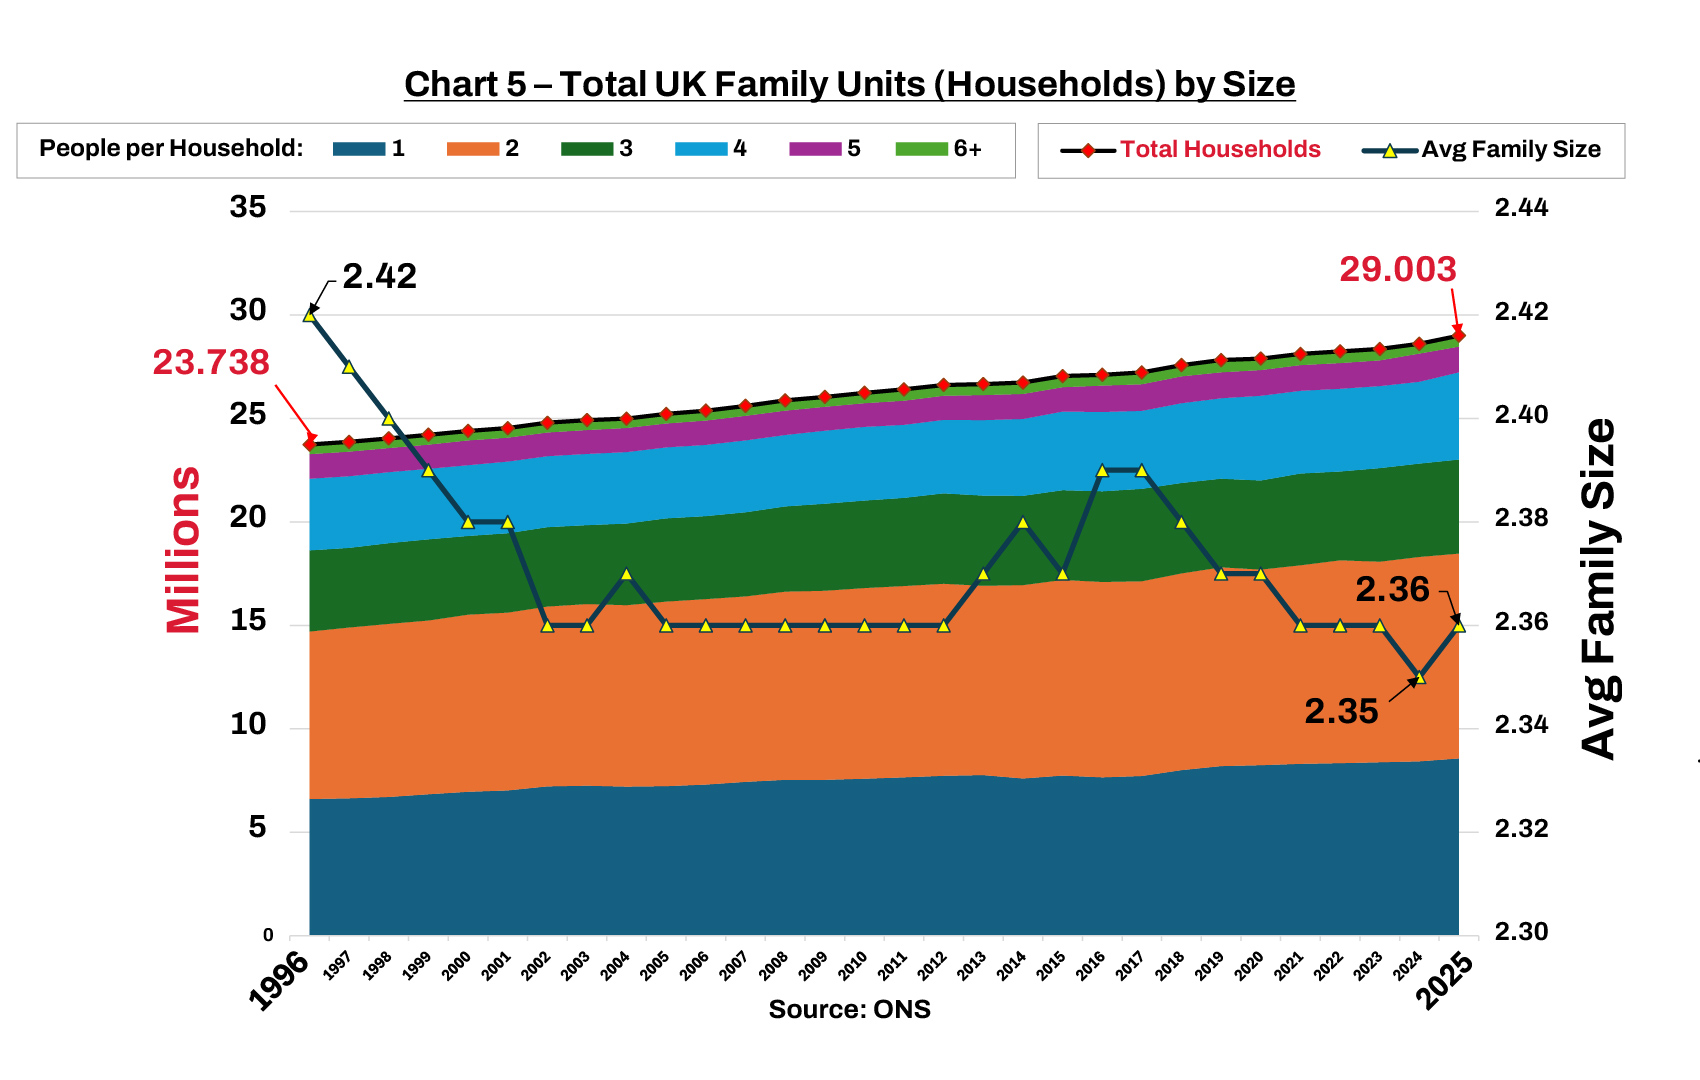
Between 1997 and 2025 the number of family units in the UK increased from 23.738 million to 29.003 million, a rise of 5.265 million, or 22.18%. The increase was not evenly distributed. Single person family units (i.e. people living on their own) increased by 29.69% whilst large family units (6 persons or more) rose by 14.04%. Smaller family units overall increased by a higher percentage than large ones, reflecting Brits’ preference for their own company and a dislike for living with lots of other people.
Population Forecasts
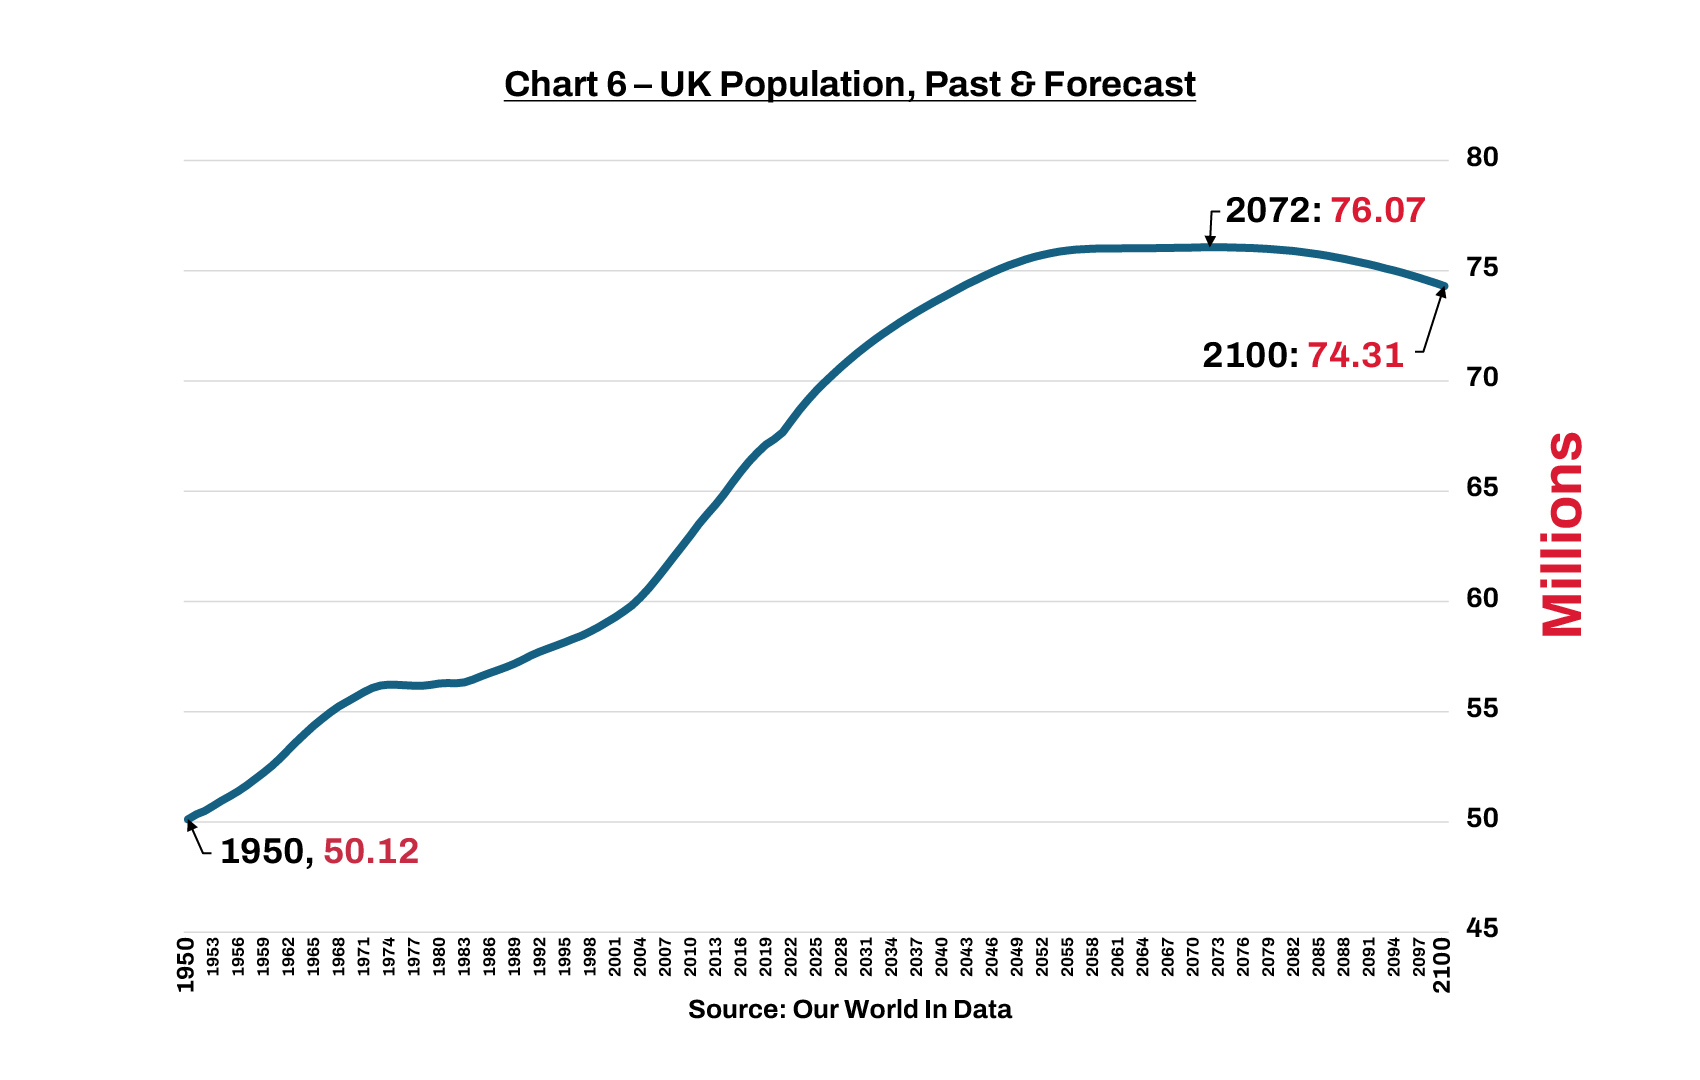
The UK population is forecast to grow to just over 76 million in 2072 before starting a steady decline thereafter (see Charts 6 & 7).
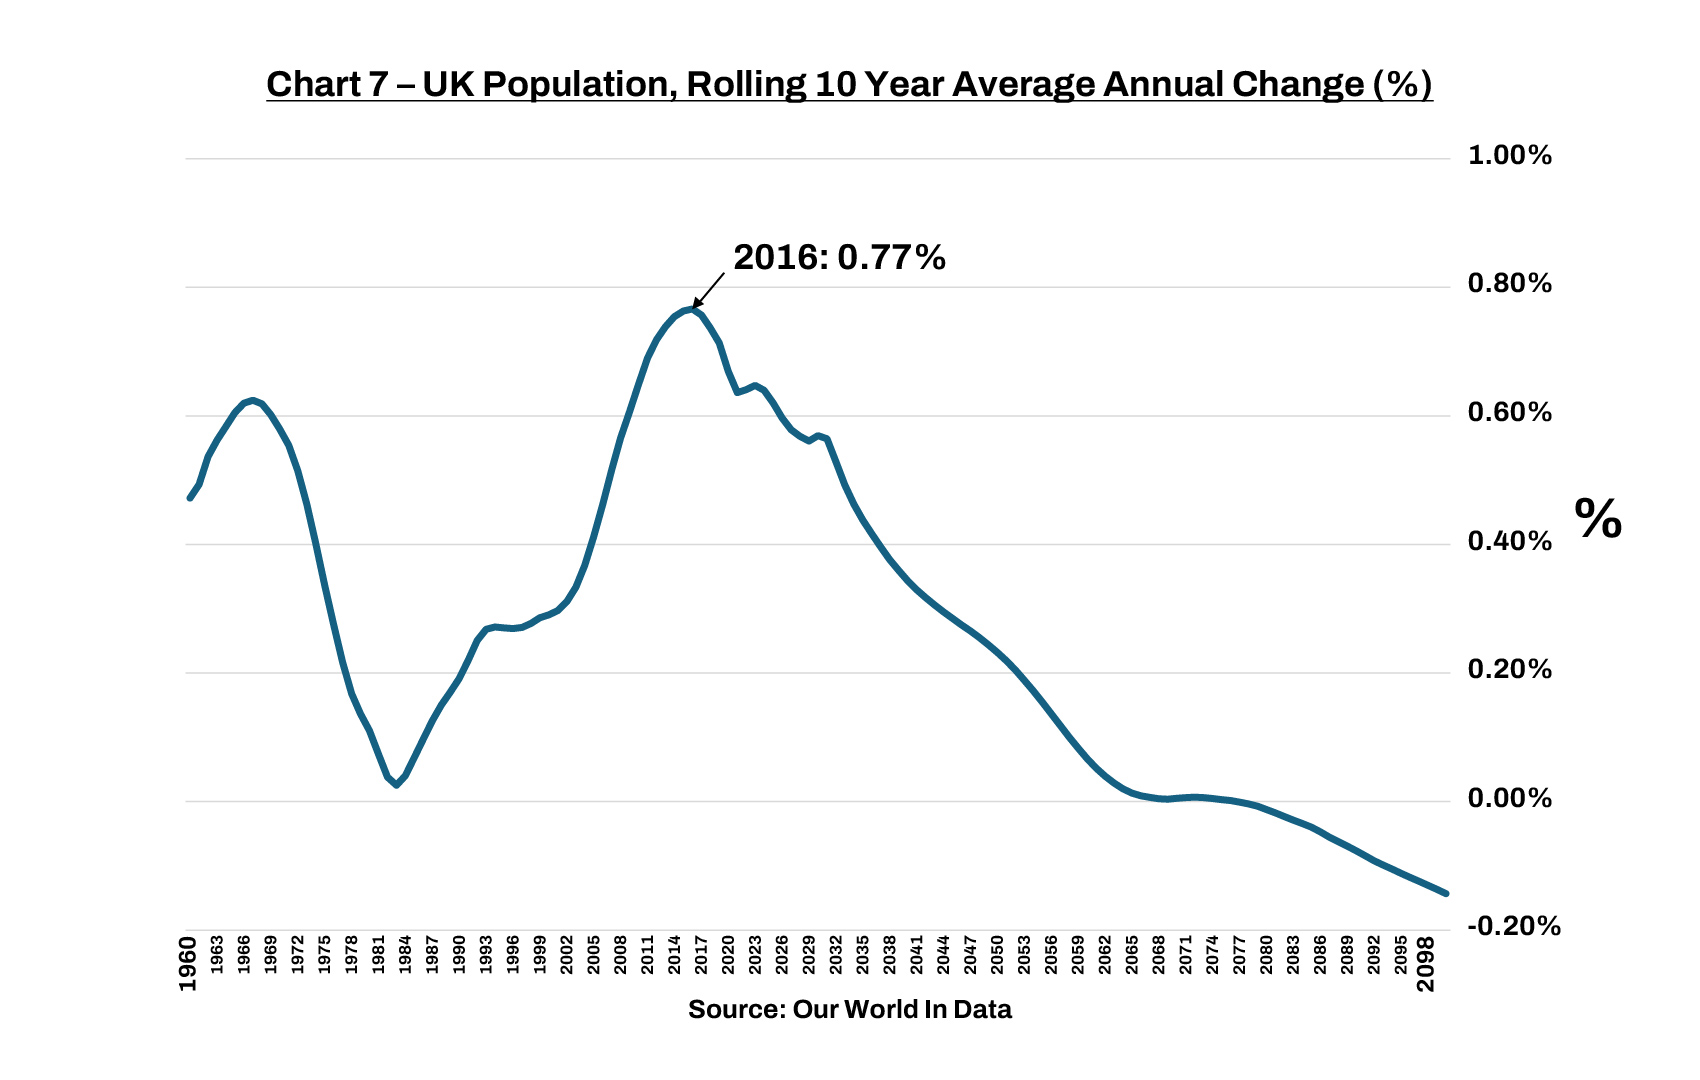
The peak rate of increase in the UK population occurred during the 10 years ending 2016 (see Chart 7) when numbers rose by 0.77% p.a. The rate of increase then drops until turning negative later in the century, but it still means that demand for housing in Britain will continue to rise for the next 40 years, and possibly at a faster rate than the general increase in the population if our preference for living alone, or in smaller family units, continues. In short, demand for UK housing is likely to remain strong for the next four decades.
If UK family units increase at a similar rate to the rise in the population generally, then we will need to build over 160,000 new housing units annually, at least in the short term, just to keep up with fresh demand, but that won’t clear the backlog. The government are clearly aware of this, hence targeting 1.5 million new builds over 5 years1. If more people switch to living alone, then the demand for housing will be even higher than forecast by the rise in the general population.
With our population likely to continue rising for the next 40 years and Brits’ predisposition for living in ever smaller family units, the demand for housing in Britain will continue to rise. The government was therefore right to target a huge increase in available houses, but the goal to build 1.5 million new homes in this parliament looks fanciful, with no coherent explanation as to how the figure was arrived at.
1 Technically, the 1.5m target includes refurbished properties – i.e. getting existing unoccupied buildings up and running and/or getting change of use for properties that are currently registered as non-residential.
Local Authorities to The Rescue
Although Britain’s problems with an inadequate supply of housing has persisted for 50 years, it was previously eased when local authorities built council houses in the sixties and seventies.
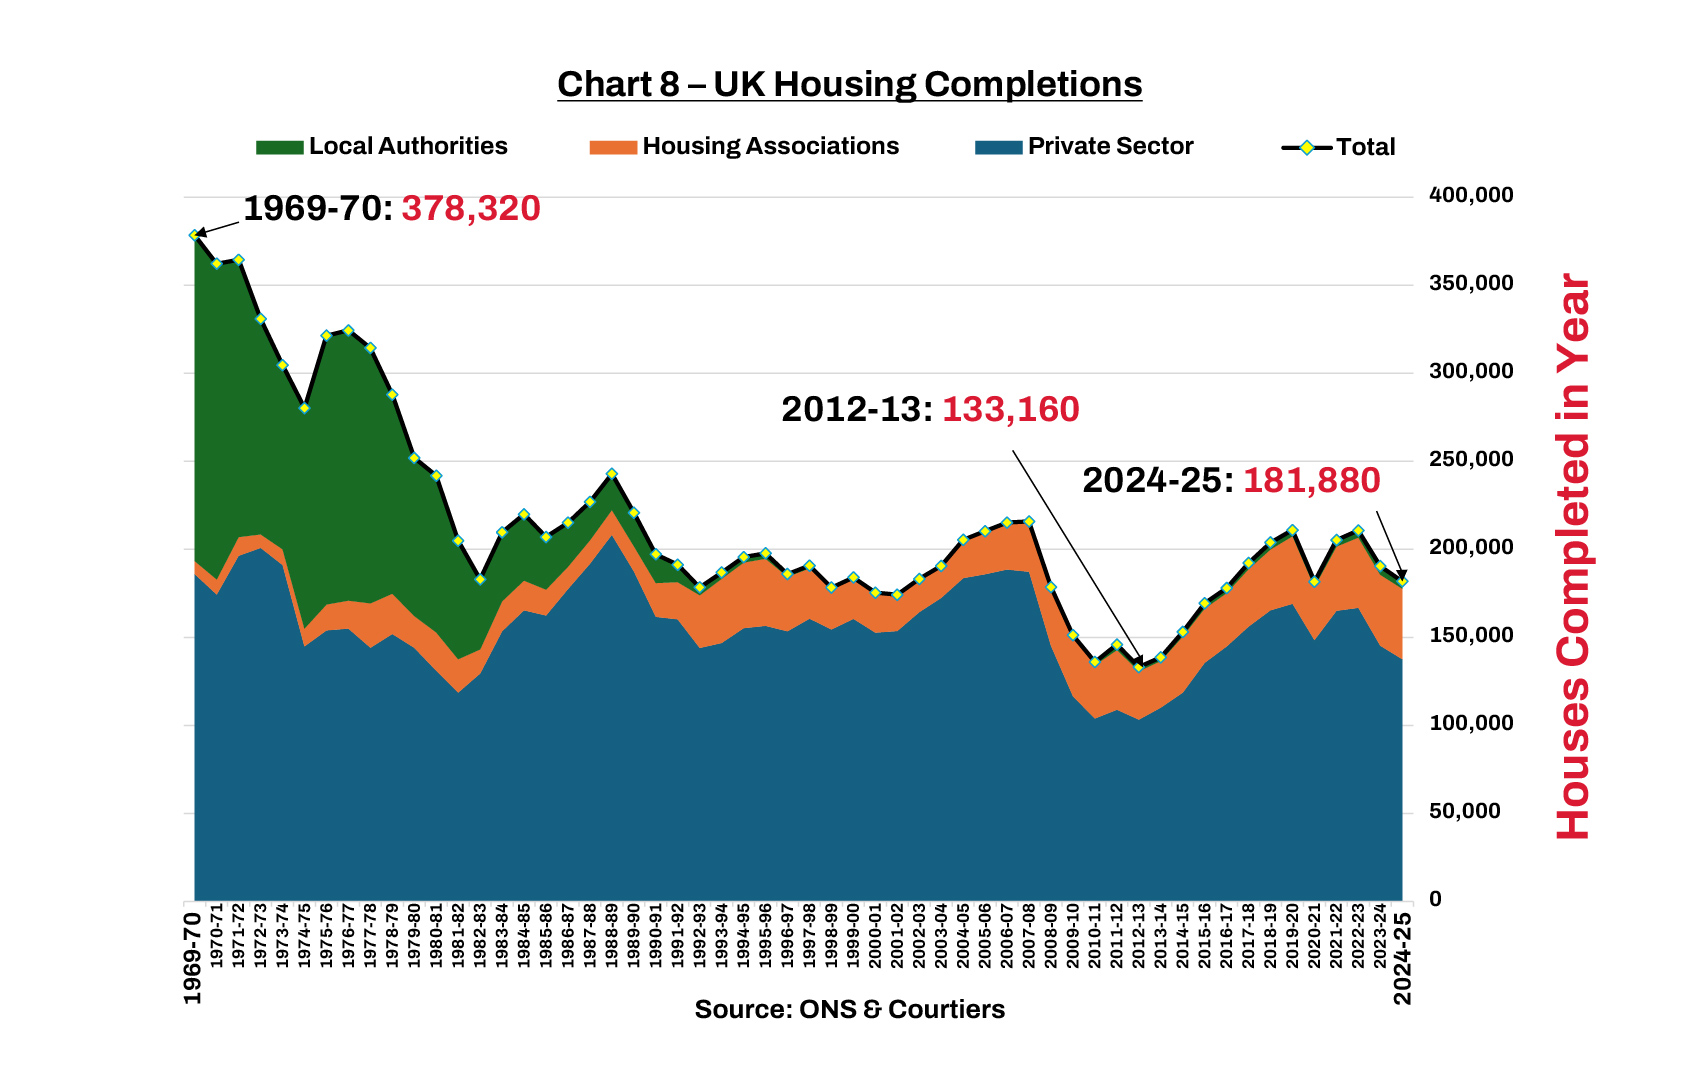
At the end of the sixties and beginning of the seventies we were building over 300,000 new housing units every year, although many of these were high rise prefab concrete flats that were subsequently demolished. Nevertheless, it shows that where there is a will, a way can be found.
Why Have House Prices Stagnated?
If you are a homeowner that has persisted reading thus far you may now be thinking, “if there is such a large shortage of housing then why isn’t the price of mine rising?” – a fair question. The answer lies in affordability. As I showed in Chart 3, the price of housing has been rising much faster than income, and the rate of rise in real UK household income (i.e. adjusted for inflation) has been slowing.
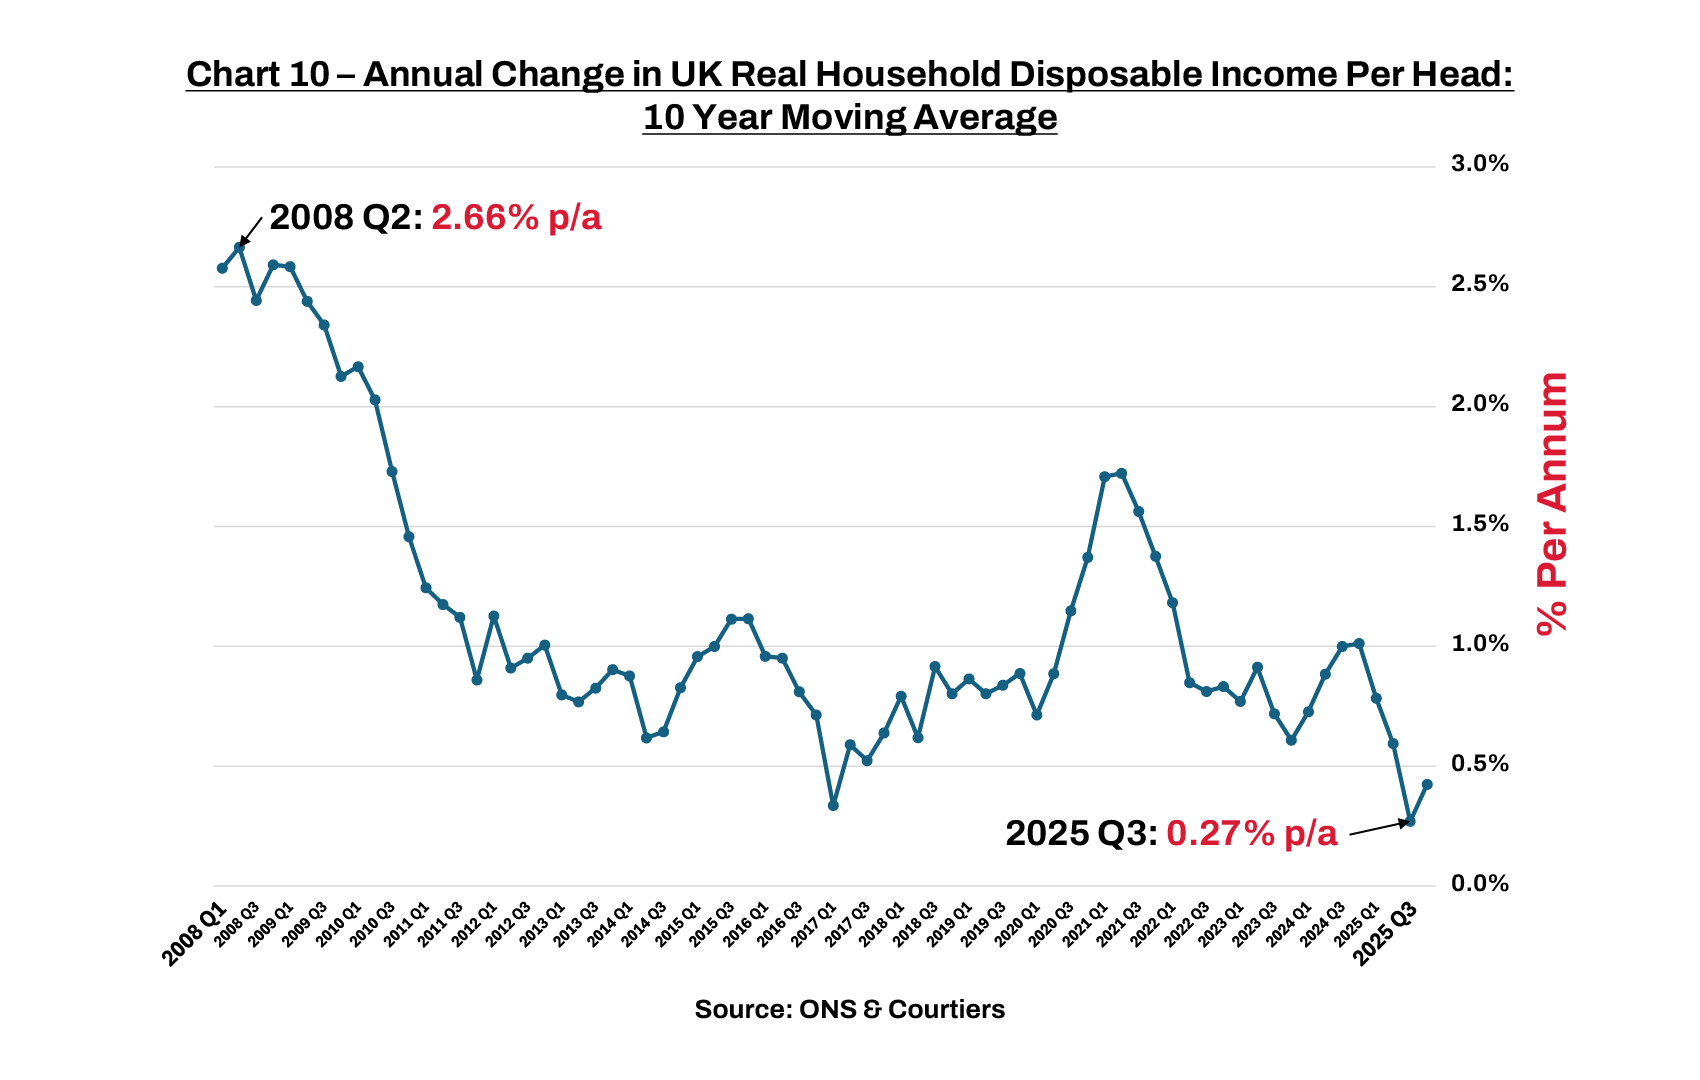
Real disposable household income per head grew strongly between Q2 1998 and Q2 2008, averaging a decent 2.66% p.a. Growth at this level boosts the purchasing power of everyone in the UK by 30% every 10 years. That’s a decent increase in standards of living. By contrast, growth at 0.27% p.a., the low that we reached in Q3 2025, increases purchasing power by a barely noticeable 2.7% over 10 years.
With people’s income under pressure and lending tight post the Global Financial Crisis due to regulators imposing restrictions on Britain’s banks and building societies (no more 100% mortgages!), it is small wonder that house prices have been stagnating. Were it not for the perpetual housing shortage, UK house prices would, by now, be in serious decline (and that’s without a recession).
The opportunity for UK Plc
Our shortage of housing presents a golden opportunity to build more homes and create a healthy domestic housing stock – a win-win for this and future generations. Our excellent domestic housebuilders with first class project management teams and substantial land banks will get the job done if allowed to do so, but they are battling the headwind of the UK’s draconian planning system. In her last budget speech of November 2025, the Chancellor, Rachel Reeves, said “over the last sixteen months, we have overhauled our planning system to get Britain building”. Anyone that has recently engaged with the UK’s labyrinthine planning system will find this claim as empty as the land banks sitting on our housebuilders’ balance sheets. Those that have applied for permission to build, extend or alter a property will provide a myriad of anecdotal evidence about the chronic inefficiencies within local planning departments.
Planning authorities are obliged to publish figures showing their performance against key indicators, one of which is the number of applications dealt with within the statutory determination period of 13 weeks for major projects.
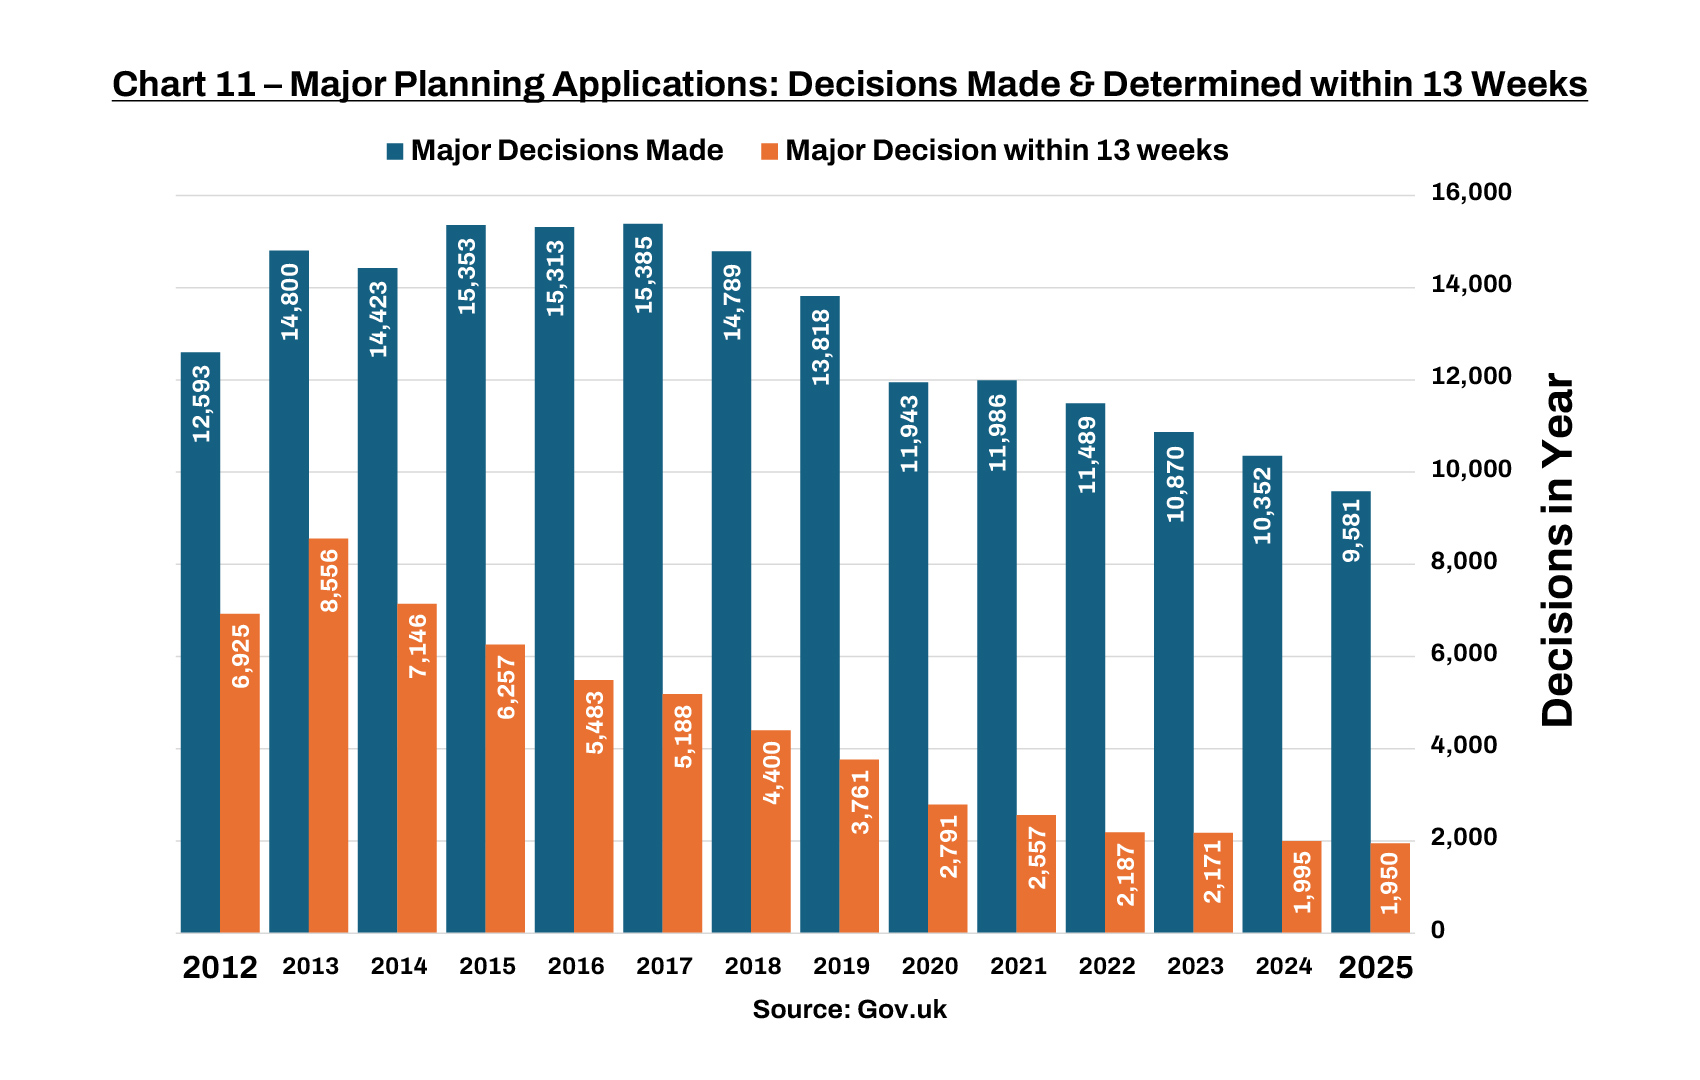
The number of applications, and those determined within 13 weeks have both been declining. Actual major applications peaked at 15,385 in 2017 but dropped to a low of 9,581 in 2025. Applications determined within 13 weeks peaked at 8,556 in 2013, but in 2025 only 1,950 were cleared within the 13-week statutory determination period.
To put this underperformance in context, Chart 12 displays the percentage of major applications determined within 13 weeks against those that fell outside the 13-week determination period.
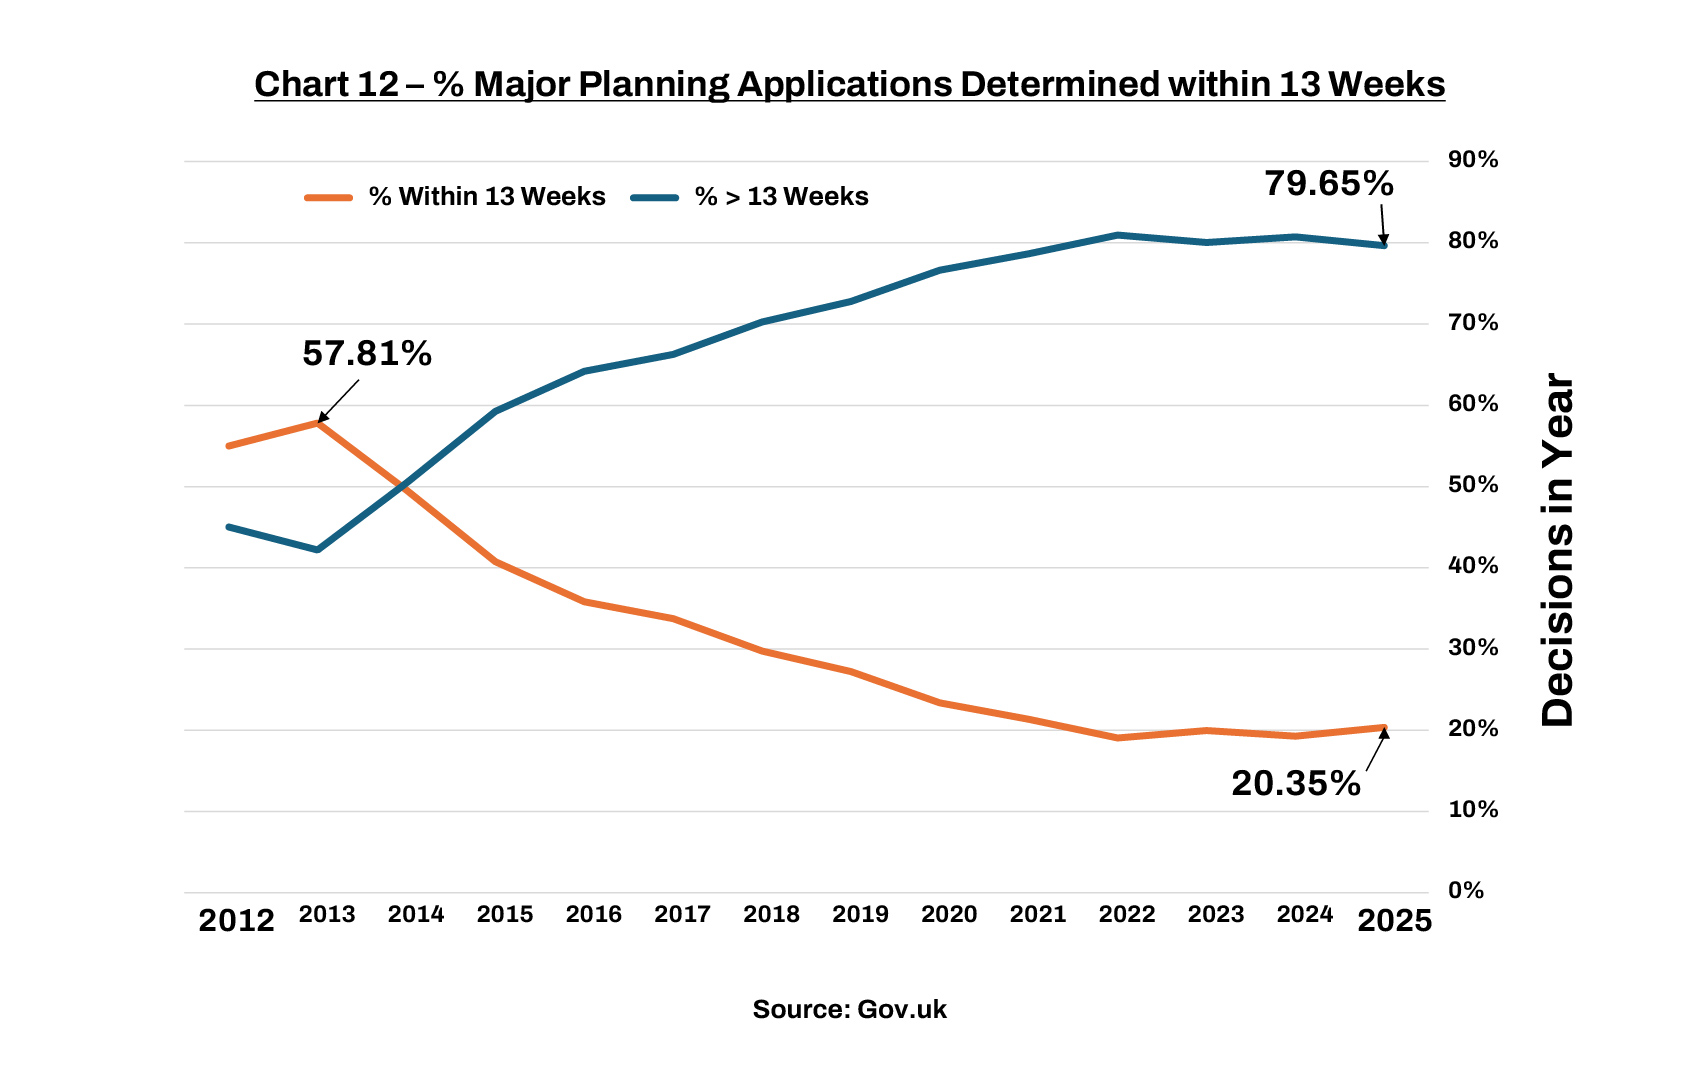
Applications determined within 13 weeks fell from 57.81% in 2013 to just 20.35% last year. We need more planning applications, and a higher number processed efficiently – we are getting neither, despite Reeves’ claims to have overhauled the planning system.
Summary
There is no material evidence of sufficient new builds, or improvements in the planning system required to stimulate them, to meet the UK’s current and future housing demand. Neither has there been any real attempt to solve the problem since Gordon Brown and John Prescott took on the challenge over 20 years ago. The UK’s housing shortage is a political failure by both major parties, but the current government is unparalleled in its use of rhetoric and unfounded claims to have solved the problem. Talk is cheap! If politicians backed up their rhetoric with actions, houses could be cheap too.