Would a -35% decline in UK GDP in Q2 this year be a catastrophe for investors?
Last week I wrote about the OBR’s (Office for Budget Responsibility) forecast that the UK economy could take a -35% nosedive in the second quarter of this year. Although the OBR predicts a recovery in Q3 and Q4, and a decline in annual GDP for this year of –12.8%1, this would still be the worst drop in output since the Great Frost of 1709.
Are Equity Returns and GDP Growth Linked?
Unfortunately, we don’t have accurate figures on 18th century equity markets to check how the recession of 1709 affected asset values, but we do have a solid series of data on UK asset returns dating back to 1900. That’s a fair period over which to make a comparison. Chart A shows returns (including dividends) for UK equities over the last 120 years. Obviously, 2020 is still young, so I have taken figures up to last Friday, 24th April and as you can see, so far it’s been a pretty poor year for UK shareholders.
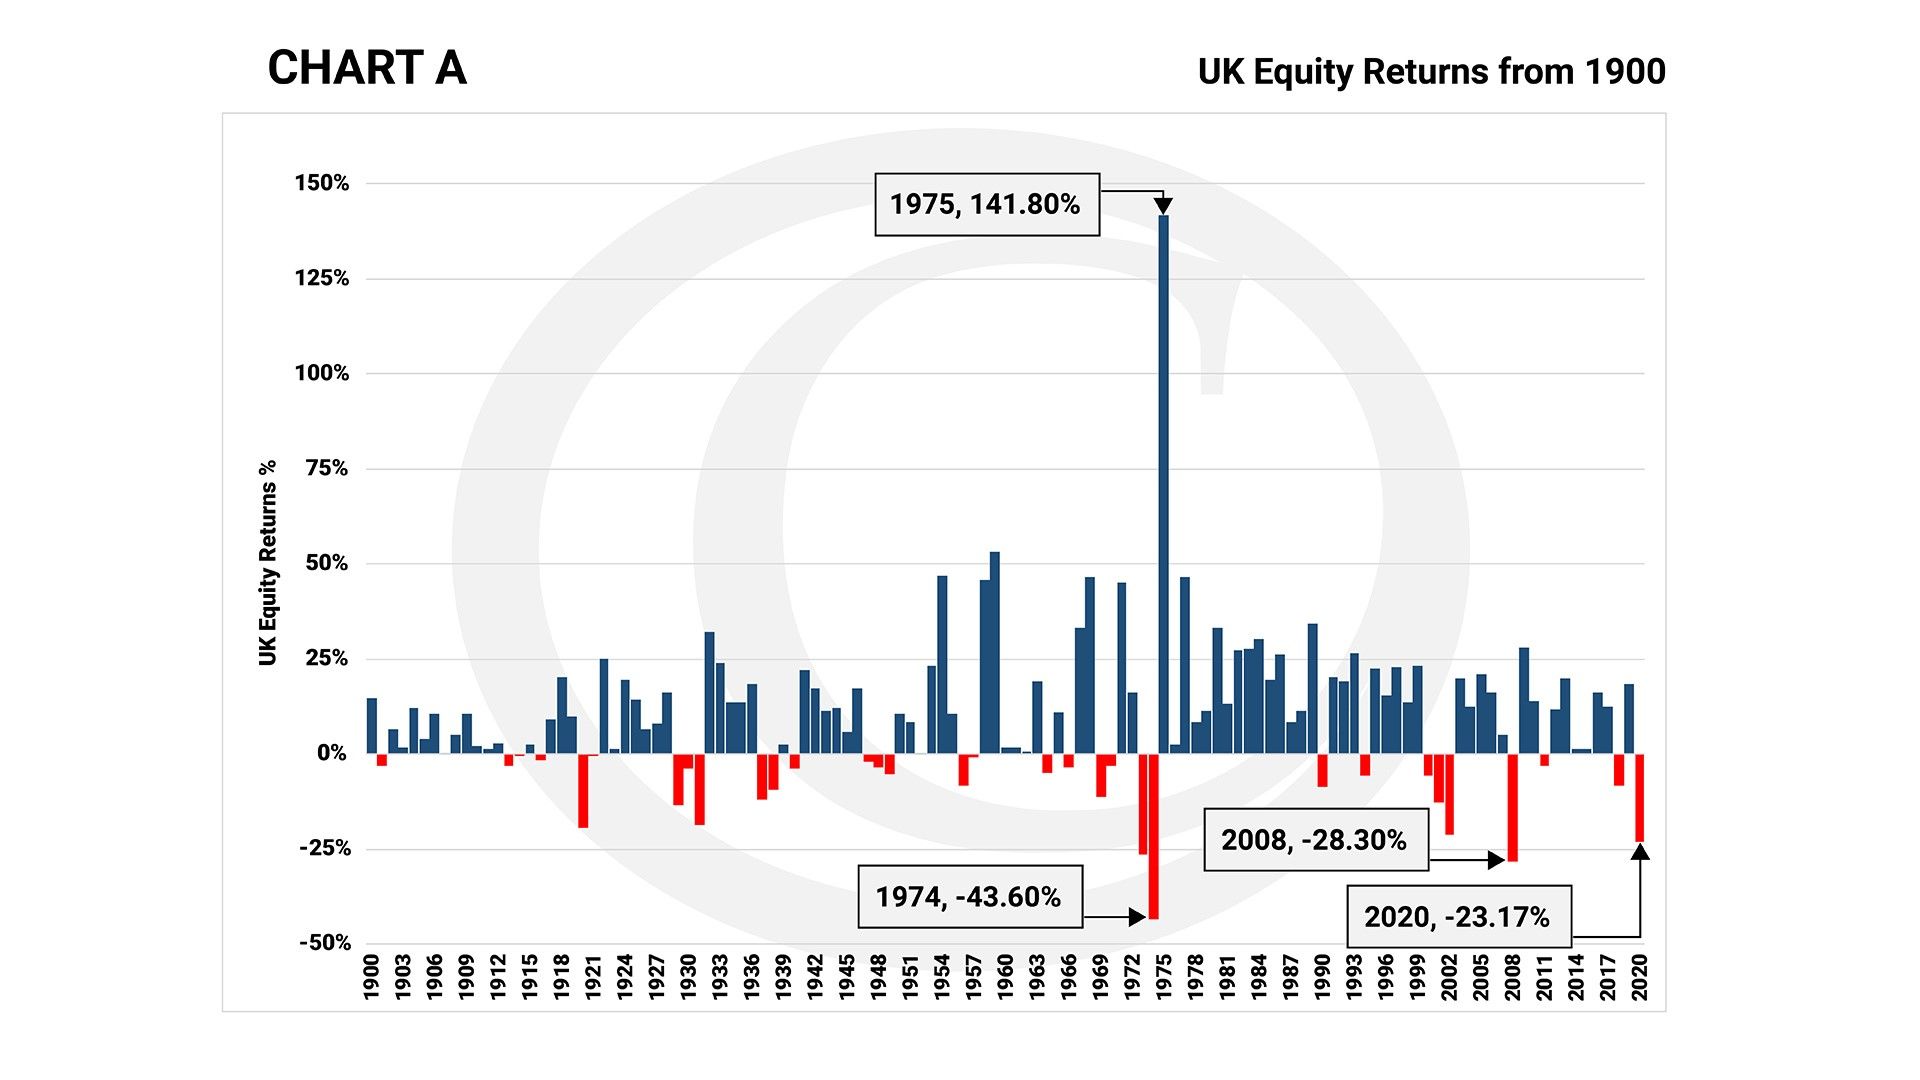
Source: Barclays Equity Gilt Study. Based on total return. Past performance is not a reliable indicator of future returns.
If I add UK GDP growth to Chart A it looks a complete mess, and it won’t necessarily tell you whether there is, or is not, a relationship between equity returns and GDP growth in the same year. For that, we need a scatter plot, which I show in Chart B below.
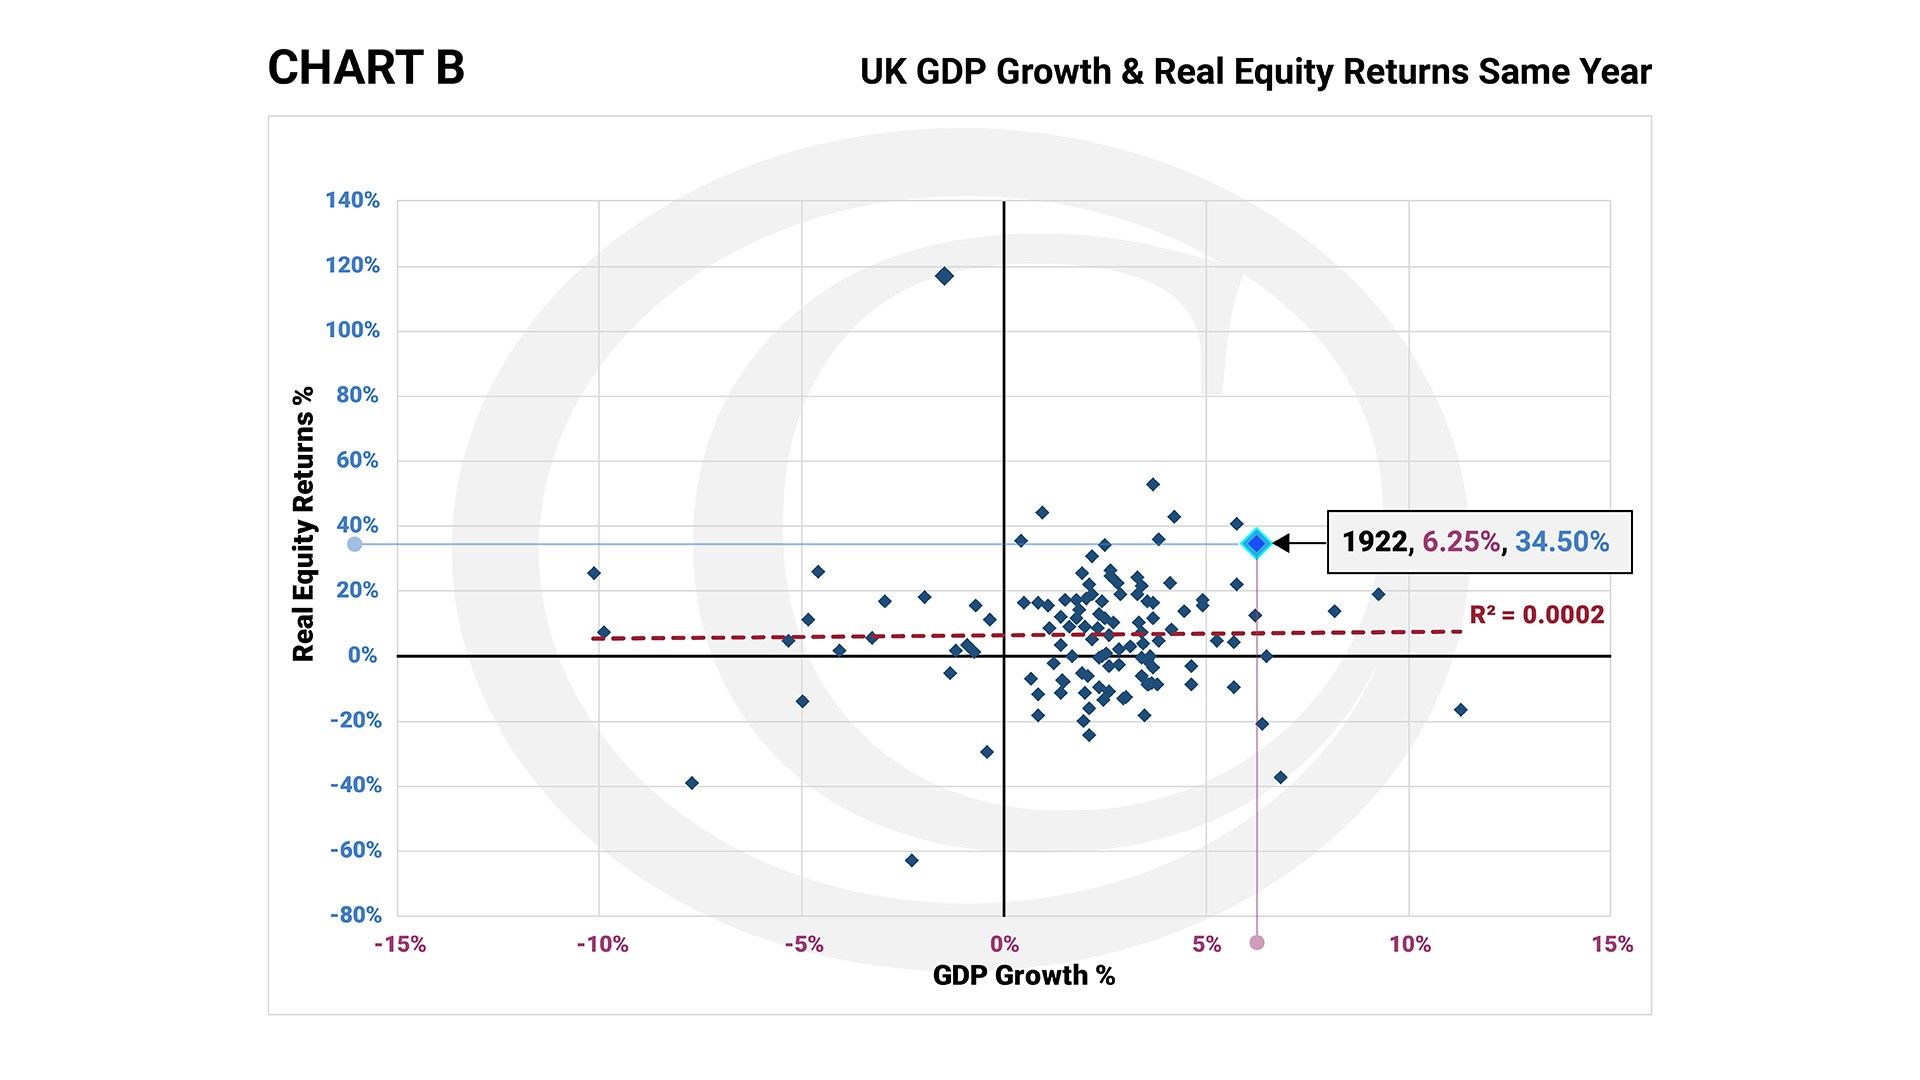
Source: Barclays Equity Gilt Study & Bank of England. Based on total return. Past performance is not a reliable indicator of future returns.
In my scatter plot, GDP growth is shown on the X (horizontal) axis and equity returns are shown on the Y (vertical) axis so that in each of the 120 years the dot is placed at the point along the X axis which represents GDP growth in that year, and the point along the Y axis which represents total “real” (inflation adjusted) equity returns in the same year. As an example, the year 1922 shows GDP growth on the X axis of 6.25% and equity returns on the Y axis of 34.5%.
Where there is a close correlation, either positive or negative, the diamonds would either trend from bottom left to top right, or top left to bottom right. The actual trend line (the dotted line) for Chart A is flat, indicating no relationship whatsoever between GDP growth and equity returns in the same year2.
Equities are meant to discount future events so one could expect that equity values would move in anticipation of what’s about to happen in the economy. Share prices in the UK certainly moved down dramatically in March in anticipation of a troubled time for the economy in Q2.
To test the idea that equity markets move in advance of a change in GDP, Chart C plots the relationship, on the same basis as Chart B, but this time the return on equities is plotted against GDP growth in the following year. The correlation is now 0.27, which indicates a tendency for equity returns to move in a similar direction to GDP growth in the following year i.e. equity returns are a better indication of future GDP growth than GDP growth is an indicator of equity returns.
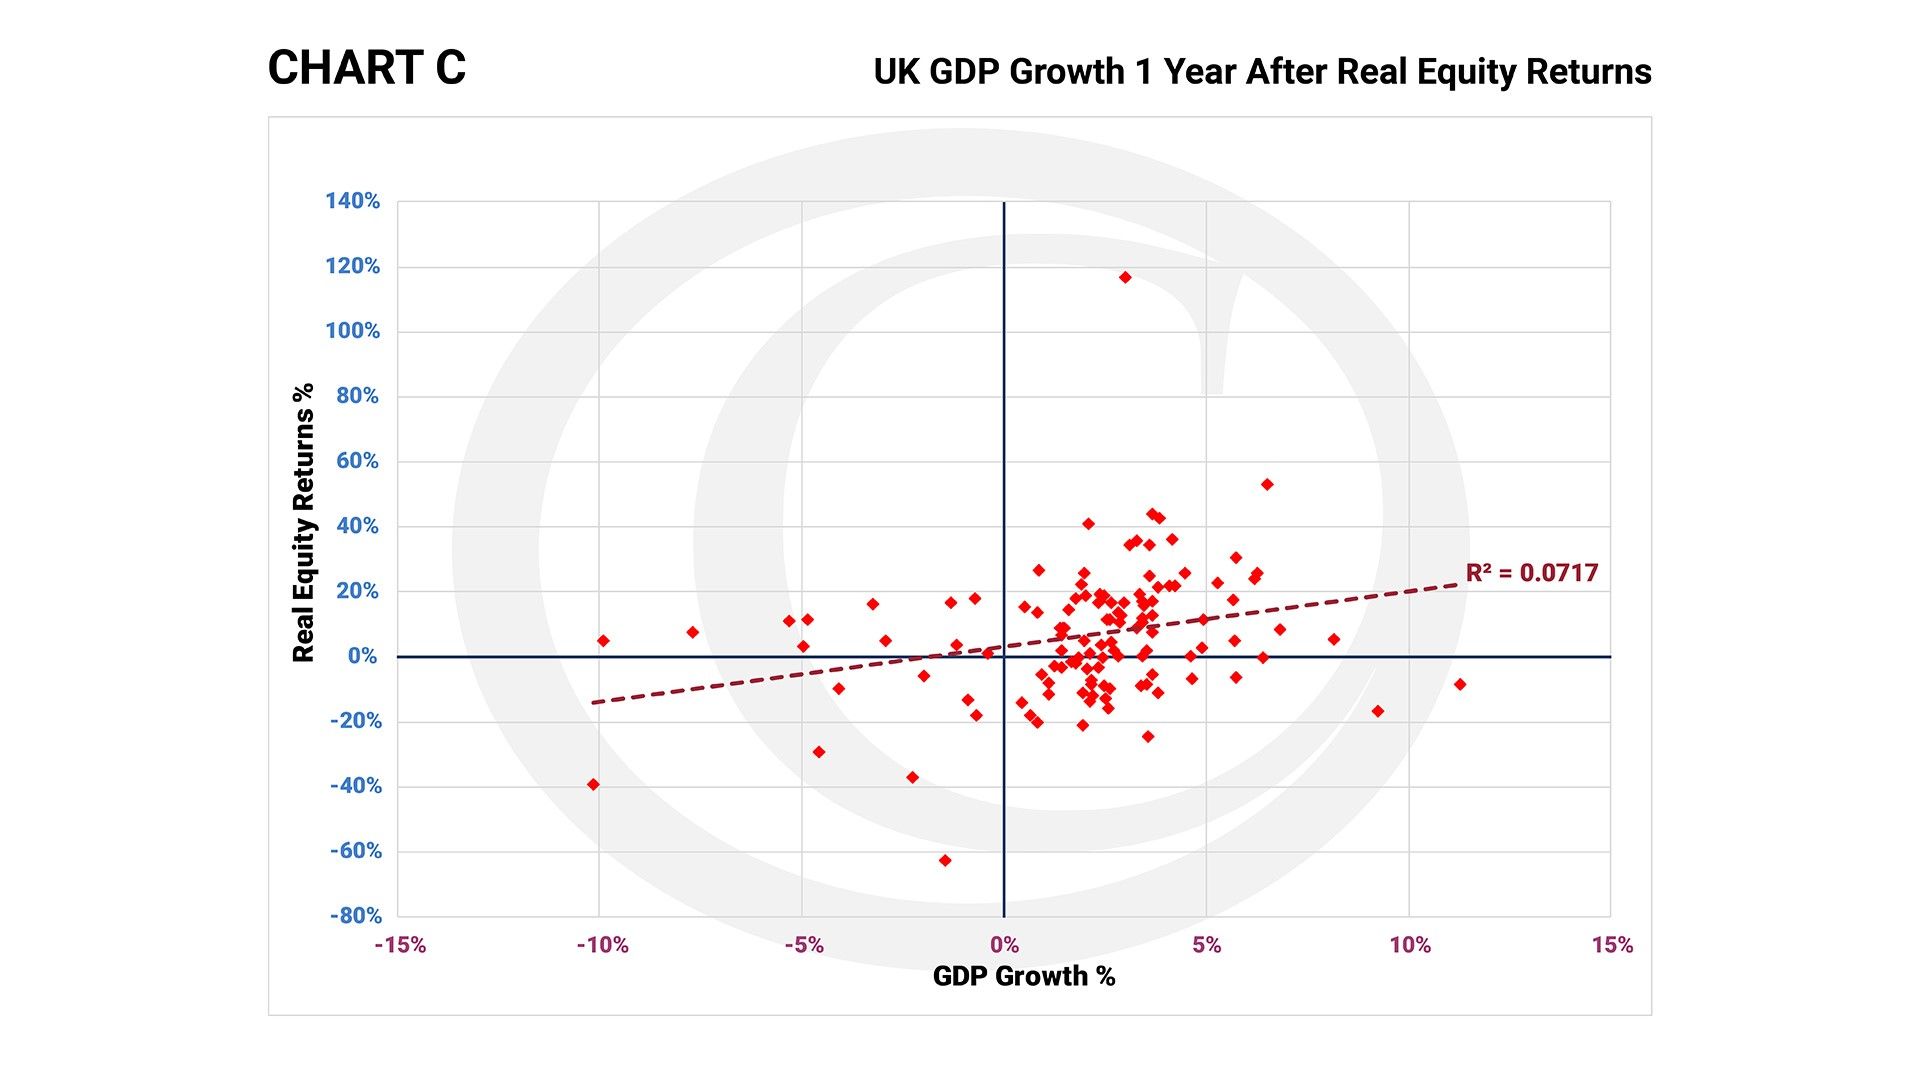
Source: Barclays Equity Gilt Study & Bank of England. Based on total return. Past performance is not a reliable indicator of future returns.
Equity markets are already discounting a savage decline in GDP for 2020, possibly the worst in over 300 years. The UK government and the Bank of England have responded with massive fiscal intervention (grants, furloughing, and spending on public services) and aggressive monetary easing (reductions in interest rates and buying-up government bonds to drive long-term costs of borrowing down) to try and offset some of the damage that the Coronavirus pandemic is doing to our economy. This is bad news for savers, especially those seeking the safer havens of cash and government securities, because the Bank of England’s intervention has reduced deposit rates. In fact the Bank of England has been so successful that holders of UK 30 year government bonds (gilts) are now receiving under 0.6% per annum, significantly less than the rate of inflation over the last 30 years. If future inflation hits the government’s 2% per annum target the holders of these long-dated gilts will see the purchasing power of their capital destroyed. This fact alone is highly supportive of equity values which offer the potential for returns significantly in excess of their “safer” bond counterparts.
The returns from equities have been, and will continue to be, more volatile than the returns from government bonds. But the rewards gained by investors that can tolerate equity volatility are enormous. £100 invested in UK gilts in 1899 would, by 24th April this year, have turned into a “real” (i.e. in 1899 pounds) amount of £325.80, an increase in purchasing power of 226% over 120 years. This may look quite attractive, until you compare it with equities. Over the same period £100 invested in UK shares would have turned into £18,289.90 in “real” terms, an increase of 18,189% (yes, over eighteen thousand percent!), which eclipses the return from gilts.
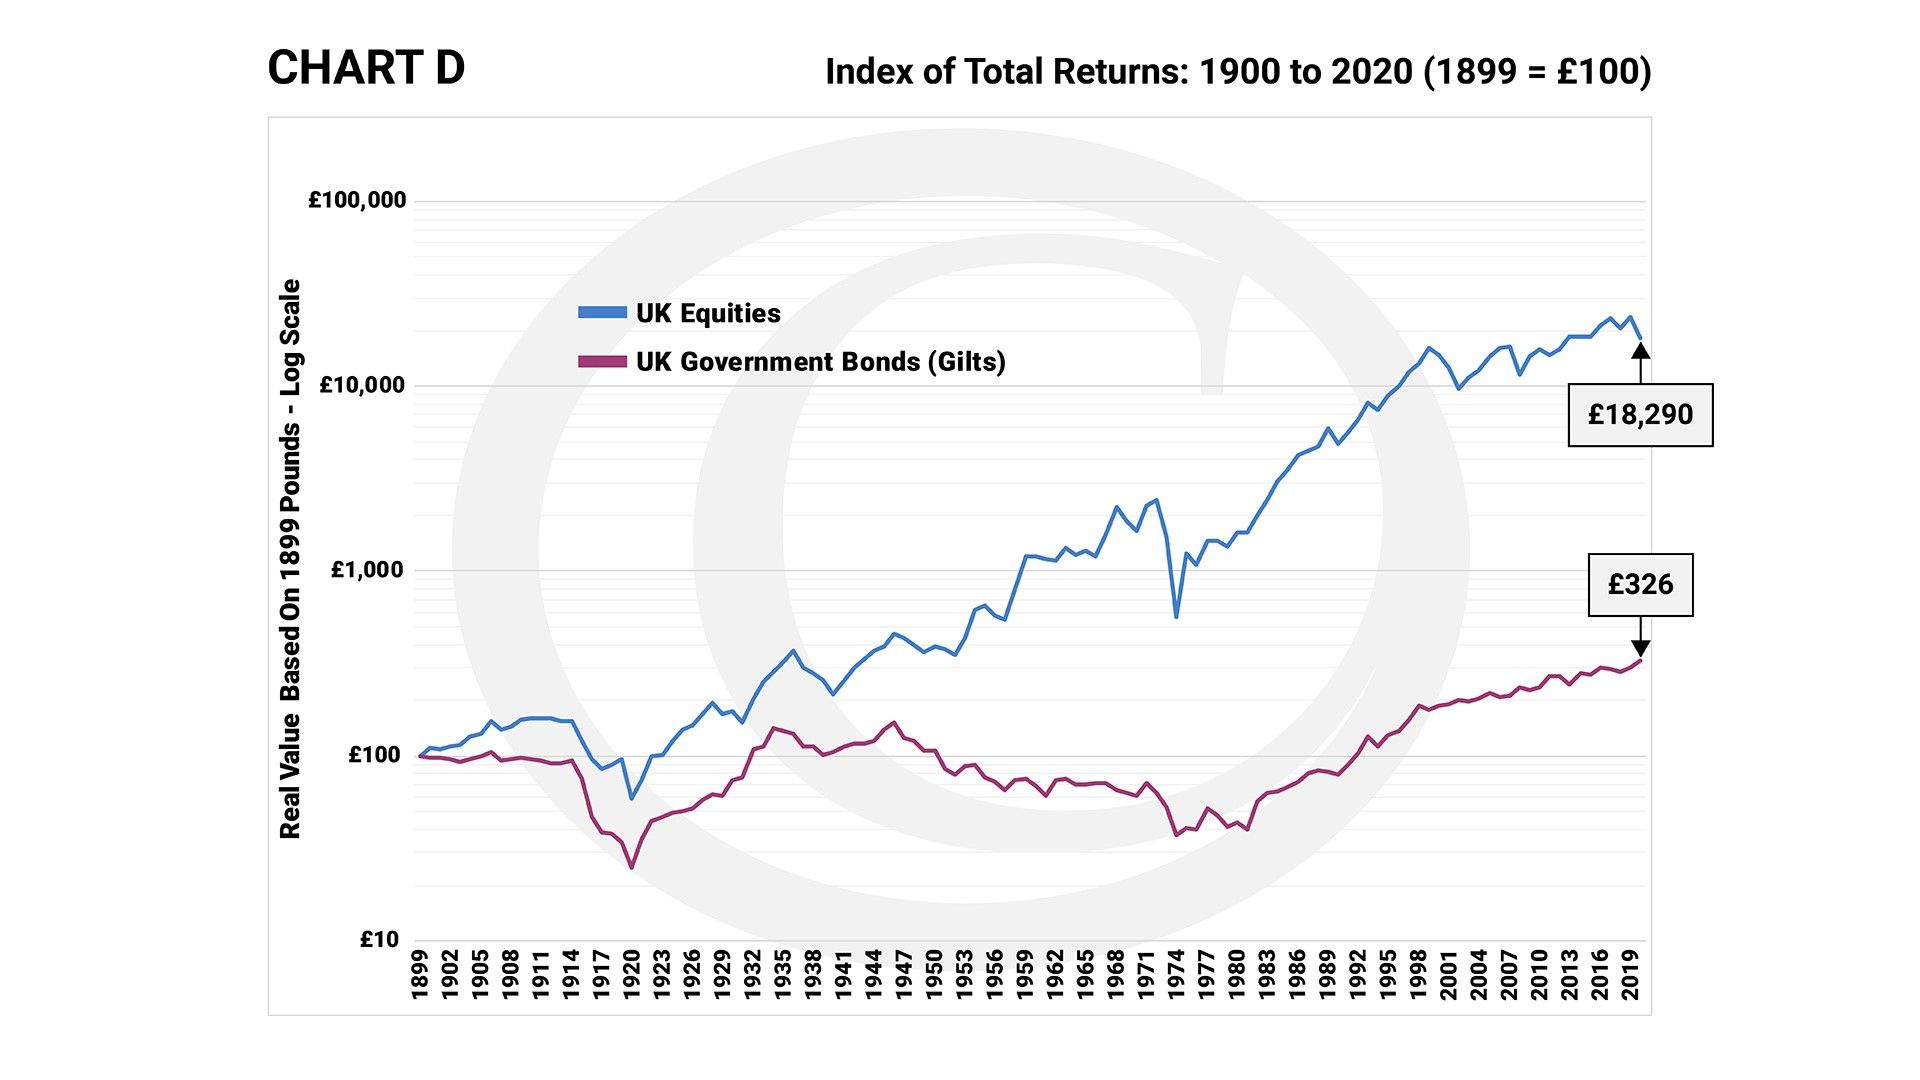
Source: Barclays Equity Gilt Study. Based on total return. Past performance is not a reliable indicator of future returns.
The equity ride is sometimes bumpy, as investors are finding out currently, but it’s sensible to keep focused on the potential prize, especially when the “safe” alternatives (like an investment in cash or long-dated gilts) is almost certain to erode the future purchasing power of capital. On a comparable basis, equities don’t look expensive at all right now, in fact they may be presenting the buying opportunity of the century!