The spectacular fall in equity prices between mid-February and mid-March has been attributed to investors’ anticipation of the decimation of company profits, in the teeth of what could turn into the worst recession for over 300 years.
For many this may seem logical. The lockdown imposed by the vast majority of leading global economies will result in a fall in output and an increase in unemployment. Hardly surprising then that peak to trough this year, the S&P 500 and the FTSE 100 fell by -34% and -35% respectively.
By mid-March, with leading Western epidemiologists likening Covid-19 to the 1918 Spanish Flu crisis, investors headed for the exit. Act in haste, repent at leisure as they say, because on 23rd March sentiment turned 180° and share prices raced upwards. Between 23rd March and 9th June the S&P 500 Index rocketed by 43% and the FTSE100 by 27%. Are these increases justified?
The father of modern investing, Benjamin Graham (the man that mentored Warren Buffett) used to say:
“In the short run, the market is a voting machine, but in the long run, it’s a weighing machine.”
He meant that in the short term, prices get driven by sentiment, but in the long term they get driven by results. Because investors don’t know in advance exactly how fast a company will grow, whether it will continue to make profits and, if it does, how much those profits will be, the buyers of shares perform a series of estimates to arrive at what they believe is the correct current value. These calculations can only account for risks that can be measured.
Markets hate uncertainty, especially when it becomes impossible to assess, like the spread of Covid-19. Unquantifiable events like these trigger panic. It’s the financial equivalent of somebody shouting ‘fire’ in a packed cinema and everybody heading for the exits. You could wait to see if it’s a hoax, but if it isn’t, by the time the burning ceiling caves in it’s probably too late to save your life. Better to ‘vote with your feet’.
Money doesn’t exist in a vacuum. Those with wealth have to hold their assets somewhere, whether it’s in bricks and mortar, land, T-Bills, Premium Bonds, a bank account, shares, gilts, precious metals, infrastructure or works of art. Investors putting money away for the long term will assess all options, consciously and/or sub-consciously, before making their choices.
Sometime around the middle of March, investors stopped panicking and began to look at likely long-term returns. If shares are expensive and risky, then what are the safer alternatives? The “safe” alternatives are neither safe, nor a real alternative. As I write, 20 year UK government bonds are paying just 0.53% per annum. Hardly attractive, especially if inflation runs higher. Property prices would likely weaken in a prolonged recession and bricks and mortar can be very illiquid. Cash could be classed as “safer”, but rates on deposits are virtually zero and there is now talk of base rates turning negative, which would mean depositors actually paying banks and building societies to hold their cash. Faced with these unappealing alternatives, perhaps we should be less surprised by investors’ preference for shares in the “spring rally”.
To put some numbers on potential returns (with and without a crisis), I made forecasts using “Gordon’s Growth Model”1 to look at how a fictitious company’s share price might perform on the basis of:-
- No pandemic
- A pandemic with a “V” shape recovery (i.e. after a short recession the economy, and profits, return to normal)
- A pandemic with a “U” shape recovery (i.e. the economy and profits decline and then take a couple of years to return to normal)
I assume our company has a book2 (balance sheet) value of £50m and a stock market value of £100m (a P/B – price to book – ratio of 2) with 1 million shares in issue (i.e. each share is worth £100).
Our company earns 10% on its book value, so it generates net profits of £5m per year (£50m x 10%). It distributes half of this to shareholders, so it pays cash dividends of £2.5m a year (equivalent to 2.5% of the share price). With its earnings (net profits) at £5m and its market value at £100m, the price to earnings ratio (PER) is 20 (£100m/£5m), which is not cheap by historic standards, but it’s a lot lower than market PERs at the time of the tech bubble.
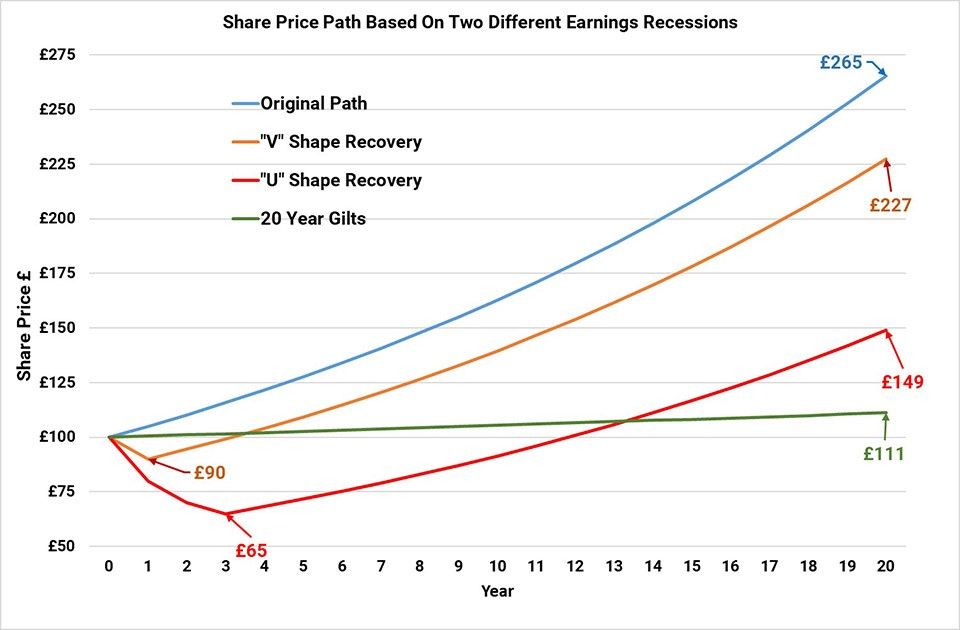
If we assume that our company reinvests half of its net profits every year and goes on getting a return of 10% on those profits, and also assuming that the P/B (price to book) ratio remains at 2 then the share price will increase steadily over 20 years from £100 to £265.3
Now let’s assume that the pandemic whacks profits and our company makes a -£5m loss, pays no dividends for 2020, but sees a “V” shape recovery of profits in 2021 when its return on balance sheet value gets back to 10%. The short term share price declines by £10 to £90, but by the end of the 20th year it’s up to £227.
Finally, let’s assume that things get really nasty. Our company loses -£10m in 2020, -£5m in 2021 and -£2.5m in 2022. Earnings don’t return to normal until 2023 (a “U” shape recovery). Our share price declines by -35% and hits a bottom of £65 at the end of 2022, but it subsequently recovers to £149 at the end of year 20.
The chart below plots these scenarios over a 20 year period and includes the return that an investor would receive if they had put all of their money into 20 year gilts (UK government bonds) at a current rate of 0.53% per annum.
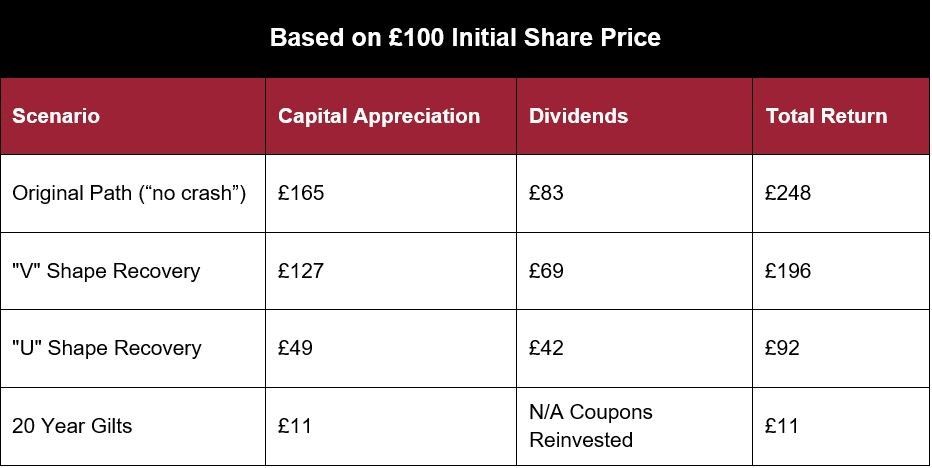
Even if our investor suffers the Armageddon scenario of three years of losses, they are still significantly better off at the end of the 20th year, through buying shares rather than UK government bonds. But that’s not all. Even for our worst-case scenario, dividends would have boosted shareholder returns in the period by another 42%, and it’s even higher in the other two examples with dividends from the “no crash” and “V-shape recovery” scenarios of 83% and 69% of the original investment respectively (see table below). That’s a lot better than the bond return over 20 years, which is a paltry £11 (11%).
Table – Forecast Total Returns Over 20 Years
The first two decades of the 21st Century have been a rollercoaster ride for equity investors, who saw the price of their shares tumble during the “Tech Bubble” (2000/2001), the “Global Financial Crisis” (2008/2009) and the “Coronavirus Pandemic” (2020 to …..?). I can understand why shareholder nerves are frayed, but long-term investors should take comfort in the fact that the cost of capital for companies today, with interest rates so low, will provide great opportunities for well-run businesses. Bondholders, on the other hand, are sitting on a time bomb of rising interest rates, which may get triggered over the next couple of years as western governments create inflation through ramped-up fiscal spending.
Any right-minded person investing for the longer term would currently choose equities over bonds, which makes the spring rally in share prices completely rational.