The Courtiers Equity Gilt Study provides a long-term, data-driven analysis of UK investment returns across equities, gilts (government bonds), cash and gold.
Drawing on over a century of historical data (1899–2025), we evaluate performance, volatility, inflation impact and inter-asset relationships to help investors understand what drives wealth creation.
This study demonstrates that while asset classes experience cycles of outperformance, long-term, inflation-adjusted returns clearly favour equities.
In line with Courtiers’ investment philosophy, the study also reinforces the importance of balancing the potential for returns with risk, time horizon and investor behaviour, particularly in an environment where historical relationships between assets are shifting.
Whilst 2025 proved an excellent 12 months for UK equities, which returned 23.05% (their best performance since 2009), gold did even better, rising by 65%. For British investors the upside was tempered by a weakening dollar, which meant that in pound sterling, they only received a 53% profit, but that’s still a very big gain.
Those that have followed these annual studies of the returns from UK equities, gilts (UK government bonds) and cash for over two decades will know that we don’t generally cover gold. One reason is because the price of gold was generally fixed by governments until 1971, when President Nixon removed the US dollar from the gold standard, allowing the price of the precious metal to find its own level. The other reason is because I don’t like it!
Gold bulls generally claim their favourite investment is superior to equities, or at the very least worthy of inclusion in any portfolio.
Are they right?
Chart 1: Annual Returns from UK Equities & Gold – Nominal Returns from 1971
Source: Bloomberg, Barclays & Courtiers
Despite a stellar 2025, gold’s performance since 1971 still lags UK equities and the returns from gold were more volatile than those from equities (a standard deviation of 25.17% for gold compared to 24.59% for equities), although in fairness, equities had bigger one-off ups and downs than the yellow metal (see Chart 2).
Chart 2: Gold & UK Equities – Nominal Return in Year in Pounds Sterling
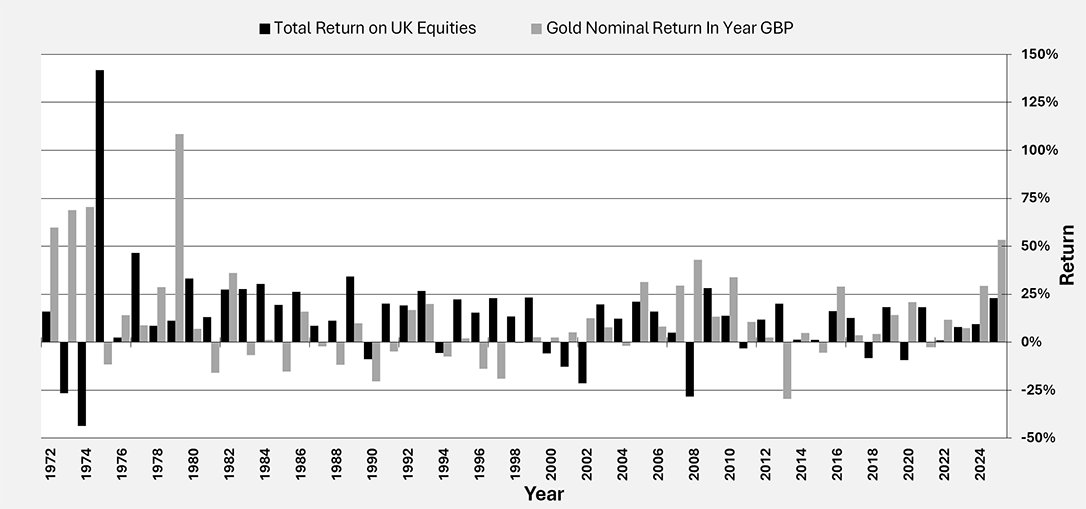
Source: Bloomberg, Barclays & Courtiers
Cash & gilts also delivered positive results in 2025 with returns of 4.25% & 5.03% respectively. These were ahead of RPI Inflation, which came in at 4.10%[1].
Over the long-term equities continue to dramatically out-perform other assets, as highlighted in Table 1 & Chart 3.
Table 1: Analysis of Annual Returns Data: Cash, Gilts and Equities from 1899 to 2024
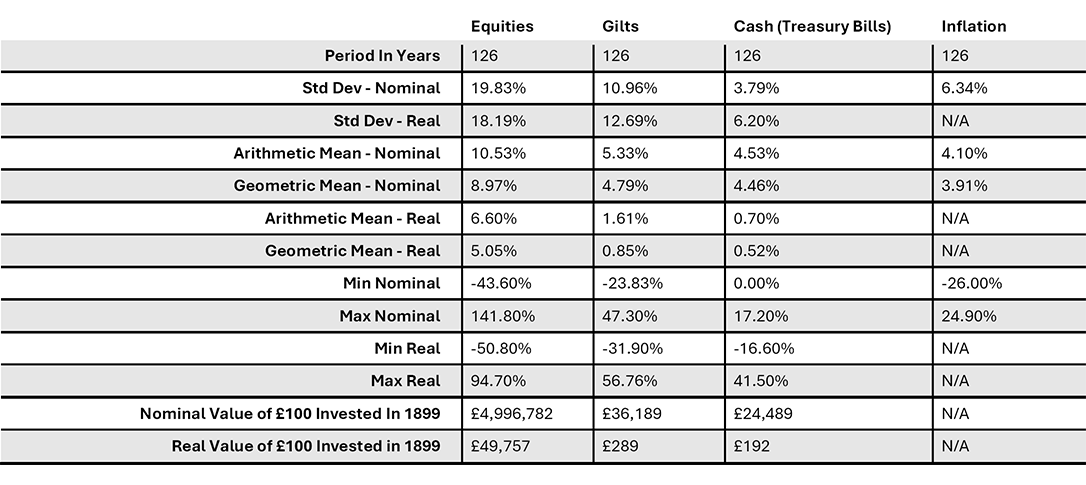
Source: Bloomberg, Barclays & Courtiers
[1] For historic comparison we use the RPI (Retail Price Index) as our inflation metric as it goes back further than the CPI (Consumer Price Index) which is considered a superior measure of inflation to RPI and is the benchmark against which the Bank of England, and most global central banks, measure inflation. The RPI tends to run hotter than the CPI due to its method of calculation and different constituent parts.
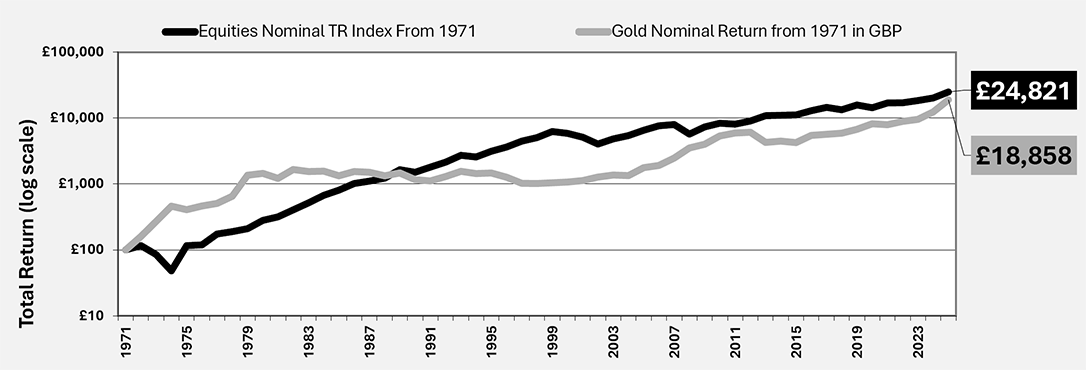
Chart 3: Nominal Returns from 1899
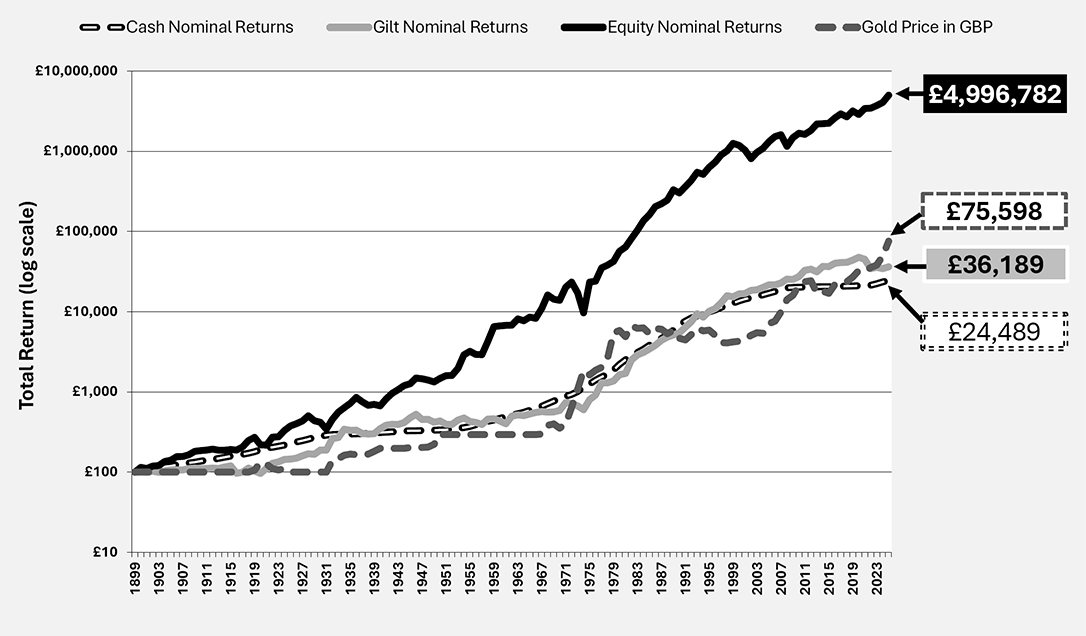
Source: Bloomberg, Barclays & Courtiers
Chart 4: Real Returns from 1899
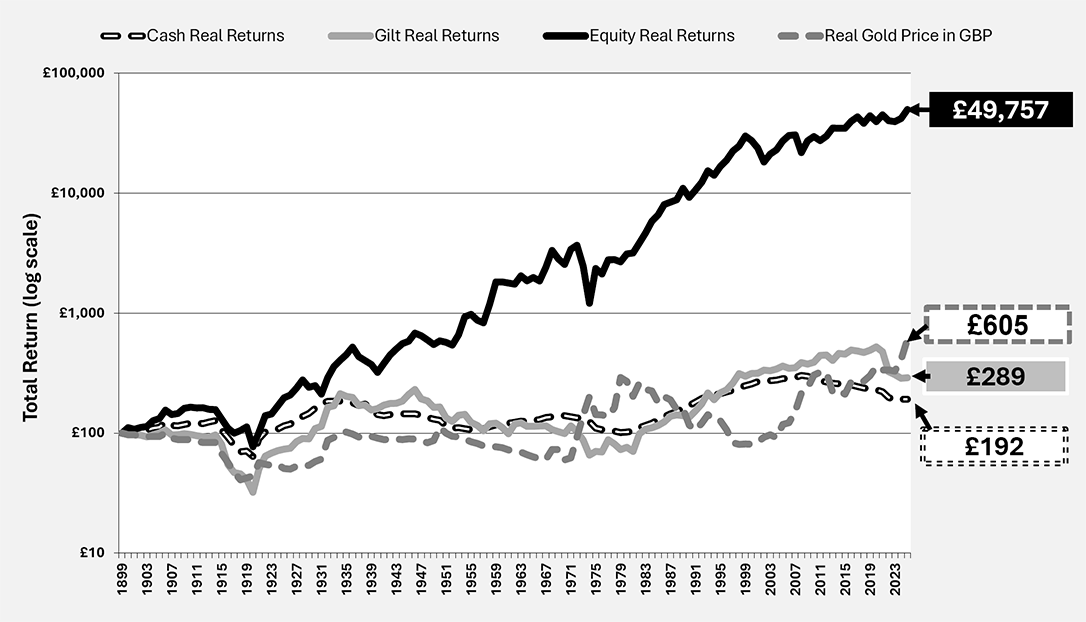
Source: Bloomberg, Barclays & Courtiers
Chart 3 highlights the very stable, fixed, price of gold through most of the 20th century. Prior to 1971 price changes for UK holders of the precious metal were either a result of government amendments, or currency movements i.e. the pound strengthening or weakening against the US dollar (mostly weakening!).
£100 invested in equities at the end of 1899 would, by 31st December 2025, be worth just a smidge under £5million, compared to £75,598 in gold, £36,189 in gilts and £24,489 in cash. Adjusting for inflation, the £100 grows to £49,757 in equities, £605 in gold, £289 in gilts and £192 in cash. Anyone with a 100-year time horizon would be a mug not to choose equities, but few have a whole century over which to accrue capital, which is where risk and reward comes in and I’ll return to these shortly.
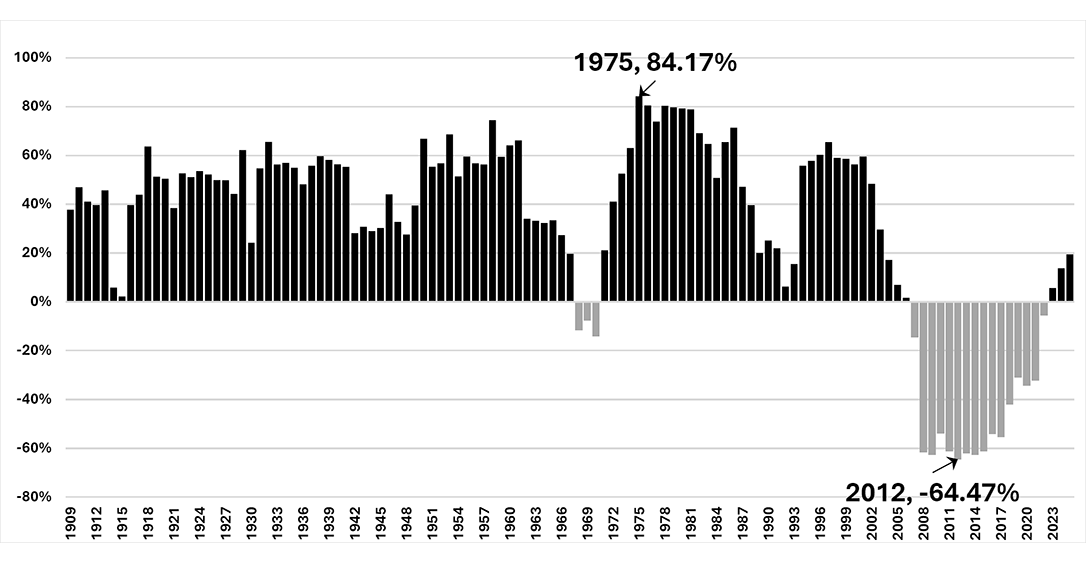
The Great Re-Correlation
Over the full 126-year period of this study, the correlation of equity & gilt returns is positive 46%. It means that equity & gilt returns generally move in the same direction, but not always. Post the GFC (Global Financial Crisis of 2007/08) the 10-year rolling correlation of gilt & equity returns turned distinctively negative and dropped to negative -64.47%. In fact, this measure of correlation stayed negative for a full 16 years, which is astounding as the previous period of negative correlation was just 3 years between 1969 – 1970.
This 16-year relationship changed after 2022 when gilts delivered their worse return in history, losing -23.83% (see Chart 5).
Chart 5: Gilt Nominal Returns since 1899
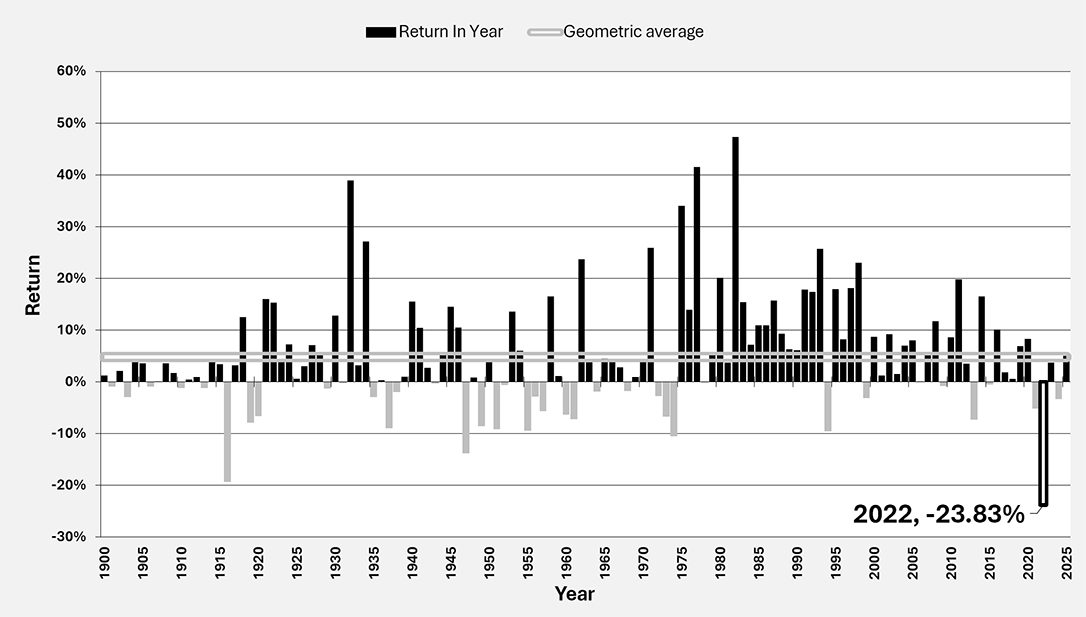
Source: Bloomberg, Barclays & Courtiers
Equities move in relatively short cycles spanning some 7-10 years depending on whose research you read. Gilts historically move in considerably longer cycles, as shown by Chart 6.
Chart 6: Gilt Prices (Nominal)
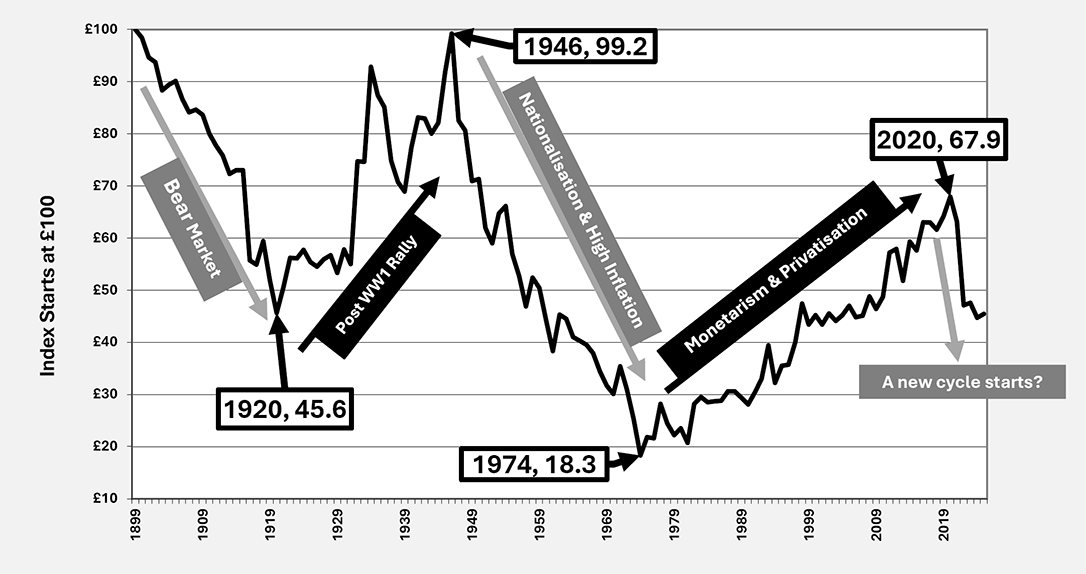
Source: Bloomberg, Barclays & Courtiers
In 2025 the 10-year correlation of returns from gilts & equities rose to 19.47%. This is likely due to:
- The global economy moving out of its post GFC doldrums with labour markets tightening and inflation returning, causing central banks to increase interest rates.
- Gilts losing their effectiveness as a hedge against a downturn in equity markets.
Chart 7: 10-Year Rolling Correlation of Returns from Gilts & Equities
Source: Barclays & Courtiers
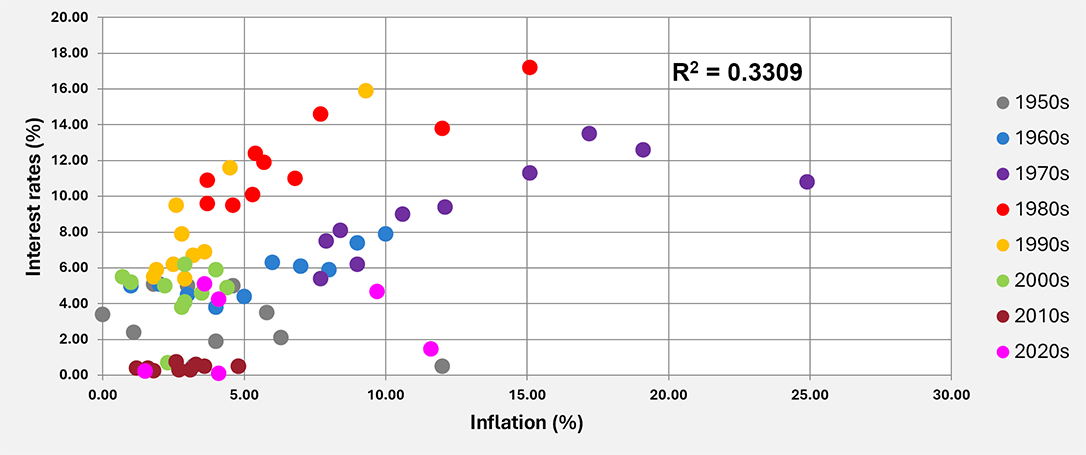
The Anomaly of the 2010s
With the global economy in the mid-2020s moving back to a more normal, inflationary, environment, we can now consider the 2010s, and the early Covid years of the subsequent decade, as an anomaly of deflation and zero or negative real interest rates. Even the UK, one of the most inflationary economies on the planet, managed a period of relative calm, as highlighted by the scatter graph in Chart 8 with the 2010s shown in the brown dots. This was a period of extraordinarily calm brought on by fiscal austerity and rising savings rates resulting in demand undershooting supply.
Chart 8: Scatter Chart: Interest Rates & Inflation
Source: Bloomberg & Courtiers
Purchasing Power – The “Real” Yardstick for Investment Returns
Whist nominal returns are the ones most frequently quoted in the media and by asset managers, it is real returns, those over and above inflation, that are the true yardstick of performance.
Someone investing £1m in equities and getting a 10% return over the year may be delighted, but it’s a hollow pleasure if inflation averaged 15% in the same period. Why? – because it means that despite growing the £1m to £1.1m, it buys less goods and services than the £1m would have done 12 months earlier. In fact, if inflation were negative, you could actually lose money for years on end and still be better off, although the anxiety from racking up more and more losses will cause deep distress to all but the most seasoned investors.
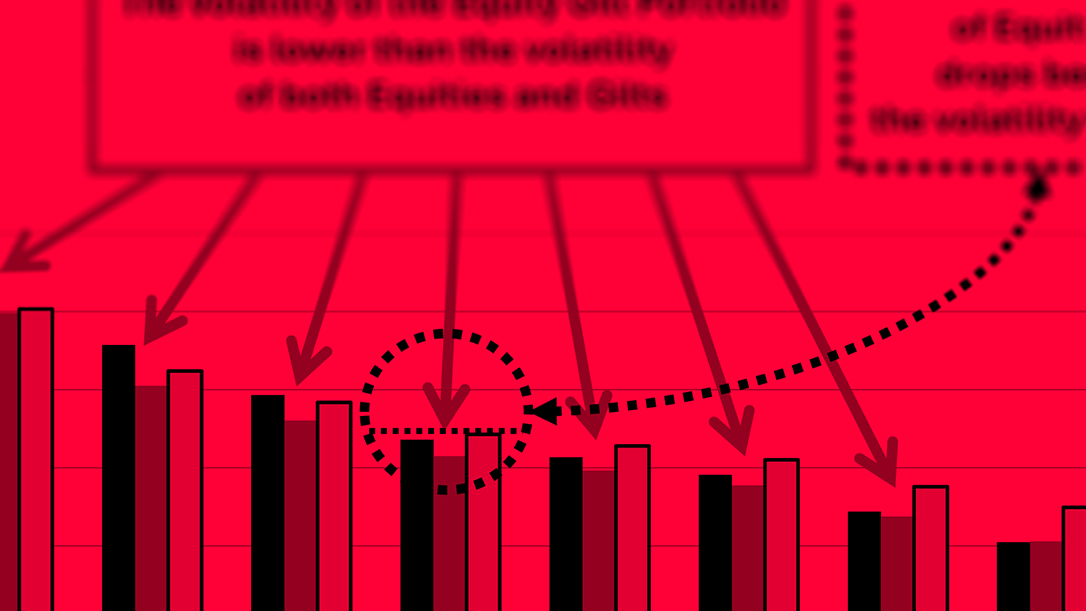
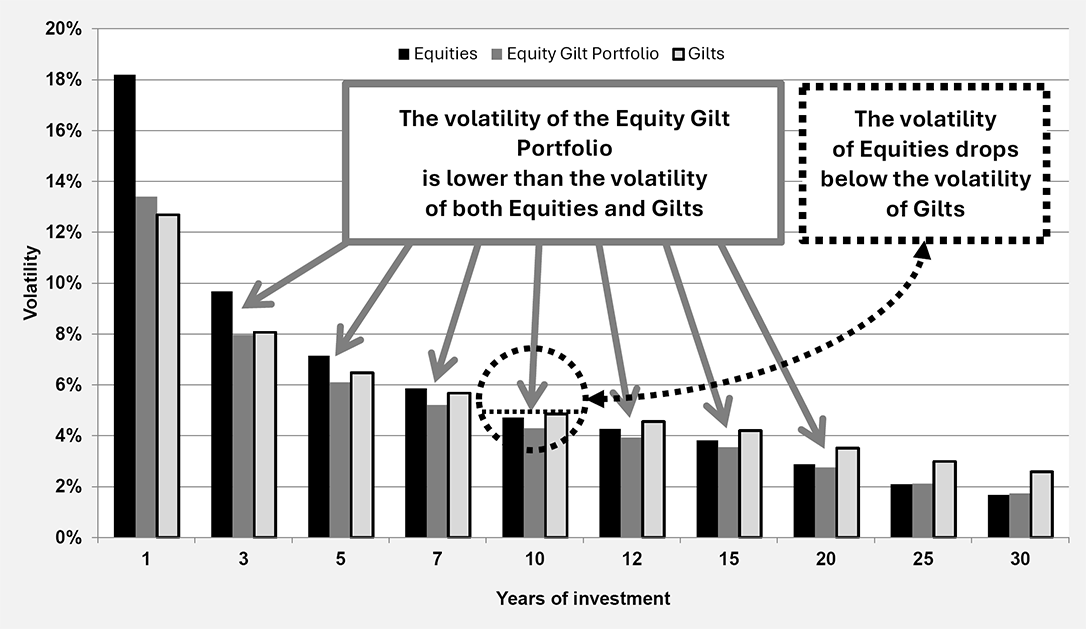
Bearing in mind that most people invest money to provide for future expenditure, the level of that expenditure, i.e. how much it has risen due to inflation, should be a key concern. For this reason, we conduct extensive analysis on both nominal and real, inflation-adjusted, returns and their volatility. It probably doesn’t surprise any reader to discover that the volatility of annual nominal returns is higher for equities over all periods, but it may surprise readers to know that once you adjust for inflation, the volatility of real returns from equities is, on average, lower than the volatility of returns from gilts for 10-year time horizons. In other words, once someone is investing for at least 10 years they should favour equities as actually safer than gilts. Although I can back up this statement with solid statistics, people are not automatons – we have feelings. Those feelings can overwhelm some that get distressed to see the value of their capital bob up and down, sometime by large amounts, on a daily basis. Emotions matter, because if they cause distress they degrade the quality of our lives, and so all investors should take only the risk that is appropriate to their ability to take it (time-horizon) and their emotional reaction to downturns (loss aversion). Both are important.
Chart 9: Volatility of Real, Inflation-Adjusted Returns
Source: Bloomberg, Barclays & Courtiers

Download a copy of this study in PDF format